Fig. 8.
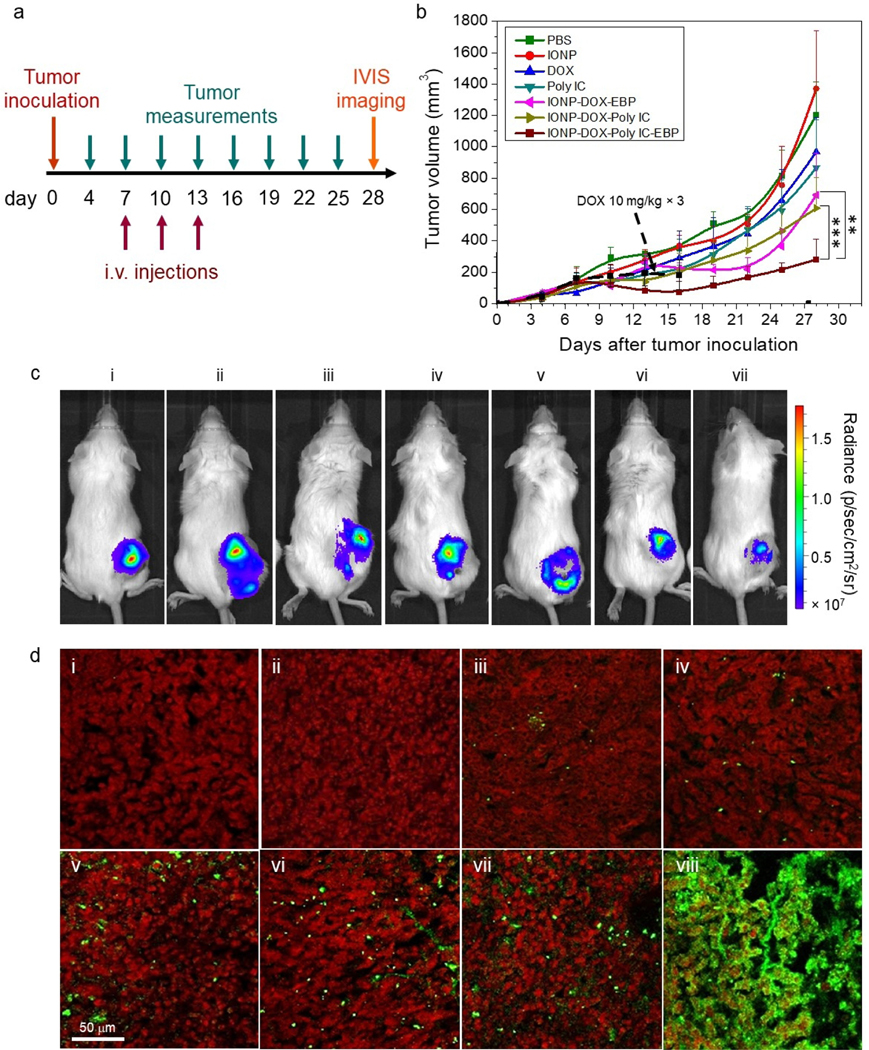
In vivo evaluation of NPs in a 4T1-luc flank tumor model of wild-type BALB/c mice. a, Schedule of tumor inoculation, treatment regimen, and monitoring. b, Tumor size as a function of time over the 28-day period shown in a., starting from tumor inoculation (day 0), for mice treated with eight agents (n = 4/per agent). **P < 0.01, ***P < 0.005 by two-way ANOVA with Turkey’s post-hoc test. Each mouse was administered three times by i.v. injection and the tumor volume was measured every three days, both following the schedule shown in a. The agents administered include PBS, IONPs, DOX (5 and 10 mg/kg), Poly IC (18 mg/kg), IONP-DOX-EBP (DOX 10 mg/kg), IONP-DOX-Poly IC (DOX 10 mg/kg, Poly IC 18 mg/kg), and IONP-DOX-Poly IC-EBP (DOX 10 mg/kg, Poly IC 18 mg/kg). Black dashed arrow indicates tumor growth curve (also black dashed) with free 10 mg/kg DOX treatment. c, Live IVIS images of mice bearing 4T1-luc tumors 48 h after intravascular administration of various agents: (i) PBS, (ii) IONPs, (iii) DOX 5 mg/kg, (iv) DOX 10 mg/kg, (v) Poly IC (18 mg/kg), (vi) IONP-DOX-EBP (DOX 10 mg/kg), (vii) IONP-DOX-Poly IC (DOX 10 mg/kg, Poly IC 18 mg/kg), and (viii) IONP-DOX-Poly IC-EBP (DOX 10 mg/kg, Poly IC 18 mg/kg). d, Confocal fluorescence microscopic images of tumor tissue sections harvested from mice treated with various agents shown in a. Tumor tissue sections were stained with Annexin V (green) for apoptotic cells and propidium iodide (red) for nuclei. Scale bar = 100 μm.

