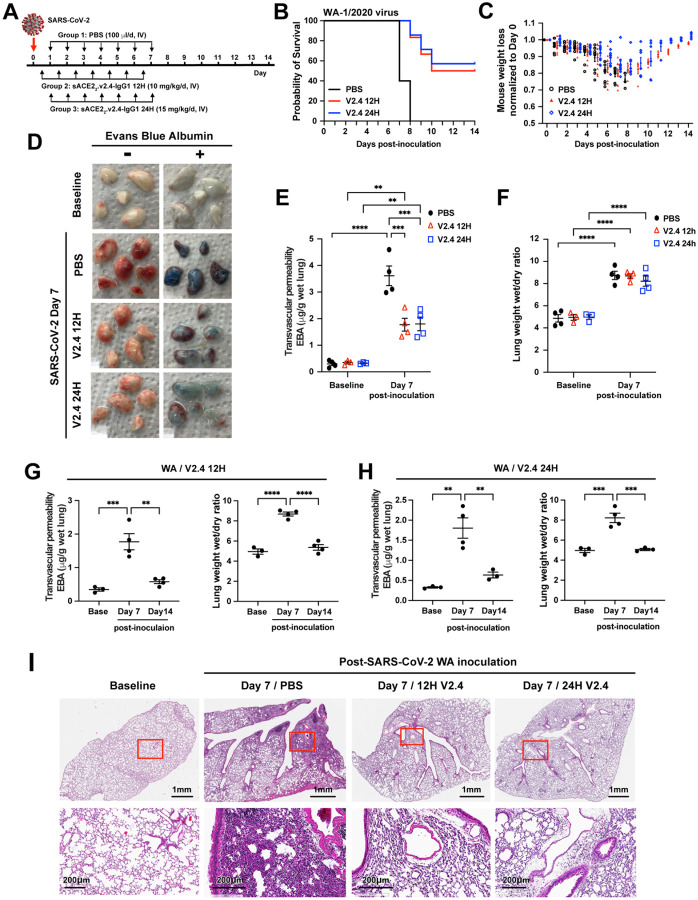
Figure 5. Treatment with sACE22.v2.4 IgG1 mitigates lung vascular endothelial injury and ARDS and improves survival induced by live SARS-CoV-2 infection.
(A) Experimental design to test the therapeutic efficacy of sACE22.v2.4-IgG1. The K18 hACE2 transgenic mice were inoculated by SARS-CoV-2 isolate WA-1/2020 at 1×10⁴ PFU. Group 1 received control PBS via IV injection 24 hours post viral inoculation. Group 2 (V2.4 12H) received sACE22.v2.4-IgG1 10mg/kg via IV injection 12 hours post inoculation, and then daily subsequent injections at the same dose. Group 3 (V2.4 24H) received sACE22.v2.4-IgG1 15mg/kg via IV injection 24 hours post inoculation and then daily subsequent injections at the same dose. (B) Survival curves and (C) Weights for N = 10 mice for each group. (D-F) Mouse lungs were harvested at Day 7 post-inoculation for assessment of lung transvascular albumin permeability. (D) Macroscopic images of lungs at baseline and day 7 post-viral inoculation in the three experimental groups without EBA (Evans Blue Albumin) on the left and with EBA injection on the right. (E) Quantification of EBA in all three experimental groups. (F) Quantification of lung edema by wet/dry ratio in all three experimental groups were shown at baseline and Day 7 post-inoculation. (G-H) Time course of lung vascular permeability of Group 2 (V2.4 12H) (G) and Group 3 (V2.4 24H) (H) as assessed by the EBA assay and by the lung wet/dry ratio. (I) Representative H&E staining of lung sections at baseline (1st column), control PBS group at day 7 post-inoculation with the WA isolate (2nd column), sACE2.V2.4-IgG 12H treatment group at day 7 (3rd column), and sACE2.V2.4-IgG 24H treatment group at day 7 (4th column) post-inoculation with the WA isolate. The images in the first row are low magnifications. Rectangle areas (Red) are shown in higher magnification in the second row. Data are presented as mean ± SEM. **: P<0.01, ***: P<0.001, ****: P<0.0001 by Two-way ANOVA for E & F; one-way ANOVA for G & H.

