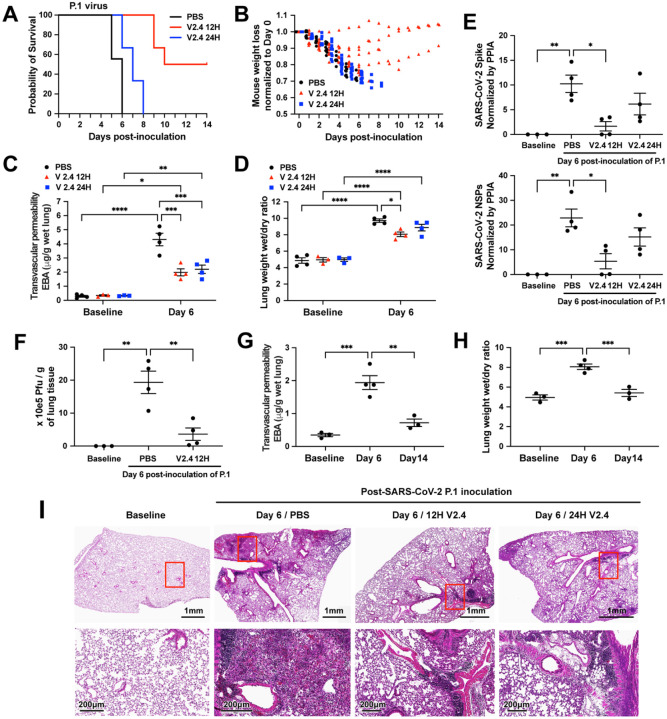
Figure 7. sACE22.v2.4 IgG1 prevents lung vascular endothelial injury and ARDS and improves survival following infection with P.1 variant of concern.
The three groups of K18 hACE2 transgenic mice were inoculated by SARS-CoV-2 variant P.1 (Brazil) at 1×10⁴ PFU. Group 1 (PBS): PBS was given by IV injection 24 hours post inoculation. Group 2 (V2.4 12H): sACE22.v2.4-IgG1 10mg/kg were given by IV injection 12 hours post inoculation. Group 3 (V2.4 24H): sACE22.v2.4-IgG1 15mg/kg were given by IV injection 24 hours post inoculation. The mice were injected once per day for 7 days. The survival probability was observed (A) and mouse weights were measured (B). N=10 for each group. (C-D) The mouse lungs were harvested at Day 6 post-inoculation to evaluate lung transvascular permeability – EBA assay (C) and lung wet/dry ratio (D) with baseline mouse lungs as control. (E) The viral loads of SARS-CoV-2 in the lungs harvested at baseline and Day 6 post-inoculation of SARS-CoV-2 variant P.1 (Brazil) were measured by real-time quantitative PCR for the mRNA expression level of SARS-CoV-2 Spike and SARS-CoV-2 NSPs. (F) Viral Plague Form Assay was performed to measure the viral loads of SARS-CoV-2 in the lungs harvested at baseline and Day 6 post-inoculation of SARS-CoV-2 variant P.1 (Brazil). (G-H) Time course of lung transvascular permeability of V2.4 12H treatment group. The EBA assay (G) and Wet/dry ratio (H) were measured at baseline, Day 6 and Day 14 post-inoculation. (I) Representative H&E staining of lung sections at baseline (1st column), control PBS group at day 7 post-inoculation with the P.1 variant (2nd column), sACE2.V2.4-IgG 12H treatment group at day 7 (3rd column), and sACE2.V2.4-IgG 24H treatment group at day 7 (4th column) post-inoculation with the P.1 variant. The images in the first row are low magnifications. Highlighted areas (Red) are shown in higher magnification in the second row. N=4 for C, D, E, F, G, and H. Data are presented by mean ± SEM. *: P<0.05, **: P<0.01, ***: P<0.001, ****: P<0.0001 by Two-way ANOVA for C & D; one-way ANOVA for E, F, G & H.

