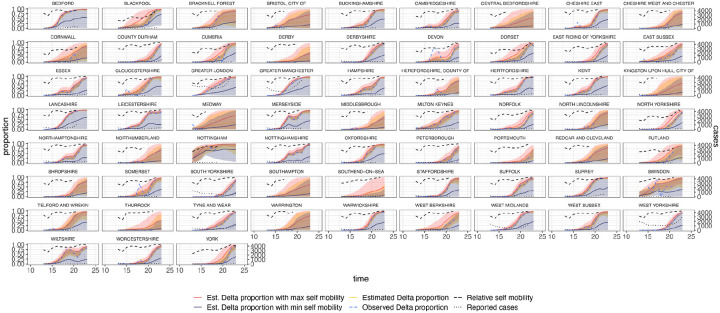
Extended Data Figure 12:
Estimated and observed proportions of Delta variant samples across UTLAs in England (yellow and blue dashed respectively), for various counterfactual scenarios: minimum (purple) and maximum relative self mobility (red), observed relative self-mobility (black dashed), and number of reported cases (black dotted dashed). The light shaded regions represent the corresponding 95% Bayesian credible intervals.

