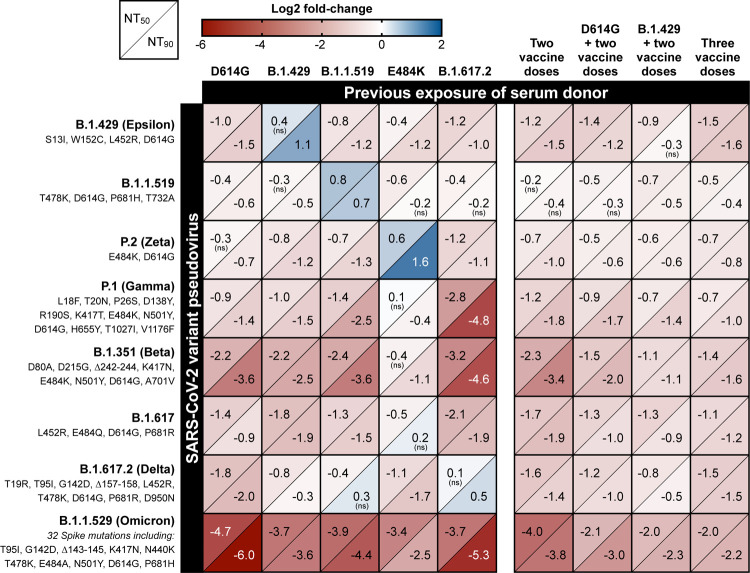
Figure 2. Change in variant pseudovirus neutralization titer relative to D614G.
Matrix of normalized neutralization titers for seven different variant pseudoviruses (rows) neutralized by seven different pools of individual sera grouped by exposure (columns). Data is represented as a heat map of the Log2 fold-change in NT50 (top left of each box) and NT90 (bottom right of each box) of each variant relative to D614G pseudovirus. All serum samples were collected at least 14 days after the date of the subject’s positive COVID-19 test or date of most recent vaccine dose. All titer measurements are the mean of at least three independent experiments, each performed with two technical replicates. Positive Log2 fold-change (blue) indicates an increase in neutralization titer for that variant relative to D614G pseudovirus, while negative Log2 fold-change (red) indicates a decrease relative to D614G. Statistical significance was determined with unpaired t-tests. All values are statistically significant (P-value < 0.05) except where noted with “ns” to indicate the difference in variant neutralization titer is not significantly different from D614G pseudovirus neutralization titer in that serum pool.

