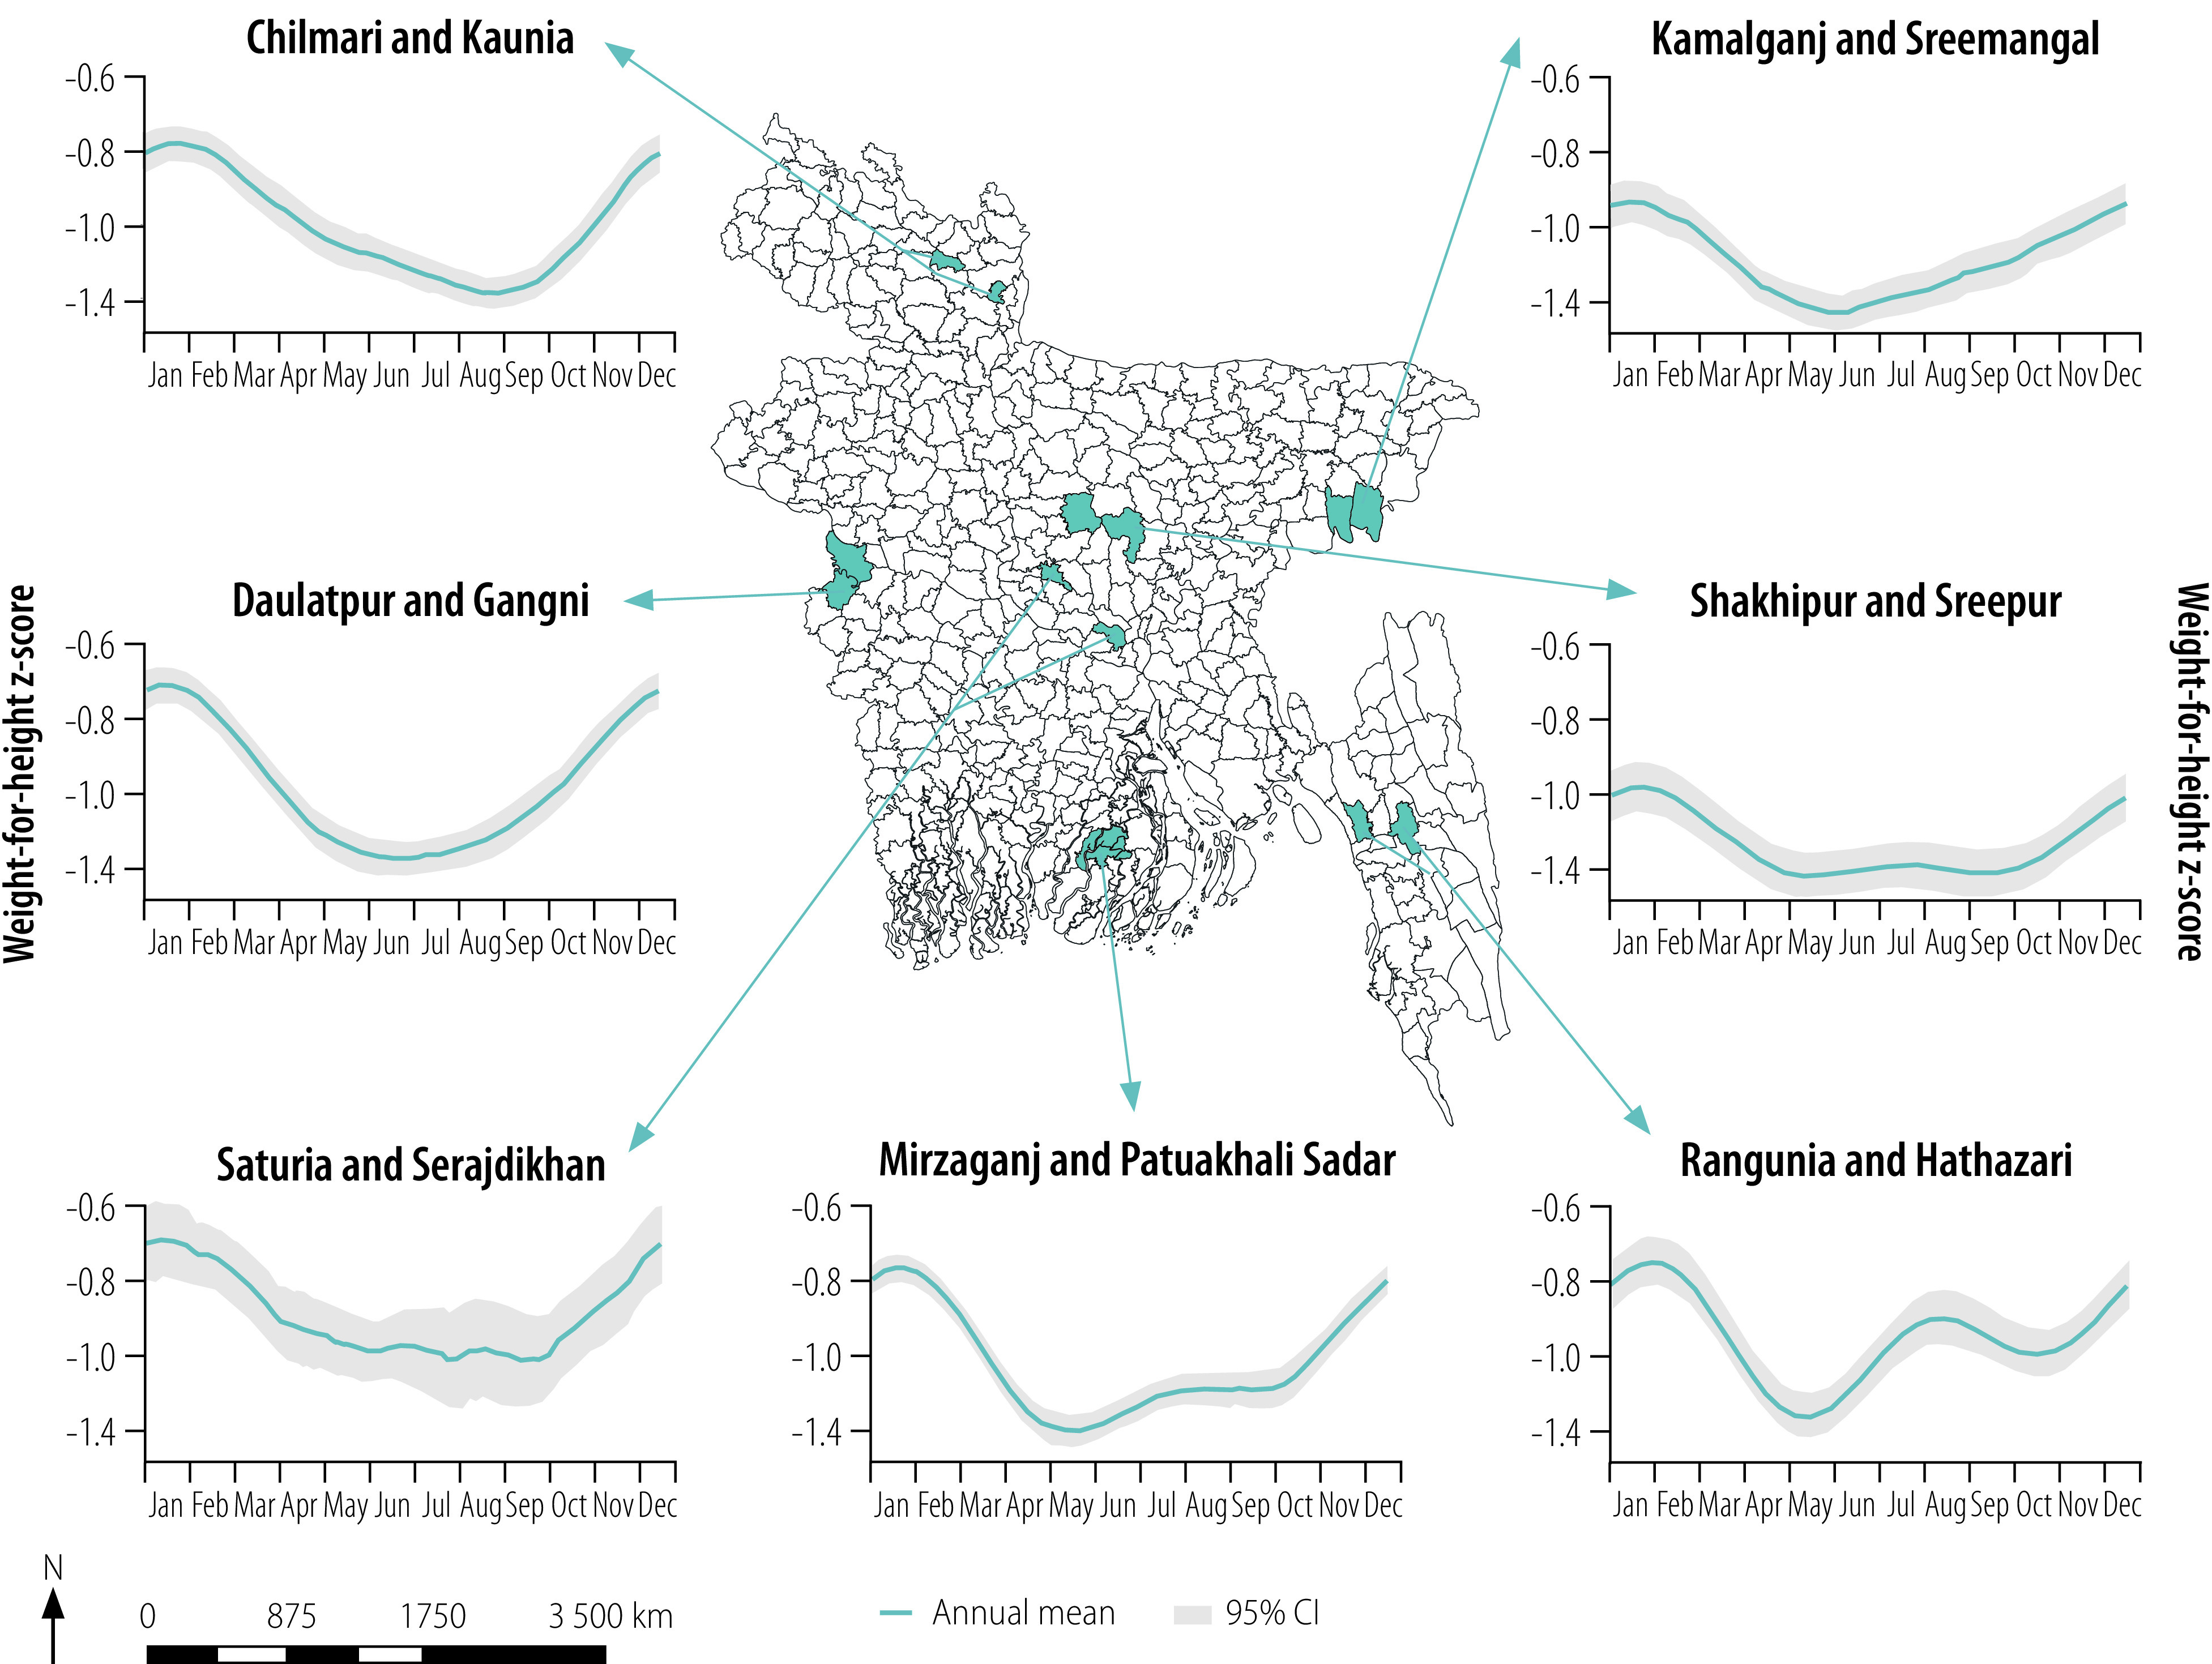
Fig. 1.
Aggregate annual weight-for-height cycles in children younger than 5 years, Bangladesh, 1990–2006
CI: confidence interval.
Notes: Mean weight-for-height z-scores were calculated by comparing each child’s weight-for-height with values derived from sex-specific, child growth curves generated by the World Health Organization in 2006. Weight-for-height z-scores were calculated on a daily basis, then smoothed across calendar days 1 to 365 for presentation (with leap days dropped). A low z-score indicates worse wasting. The individual graphs show aggregate annual values for pairs of subdistricts in Bangladesh for the period 1990 to 2006, smoothed using a sixth-order Fourier series. The analysis considered a total of 796 996 daily observations overall. The shaded areas represent 95% CI using 500 bootstrap samples.

