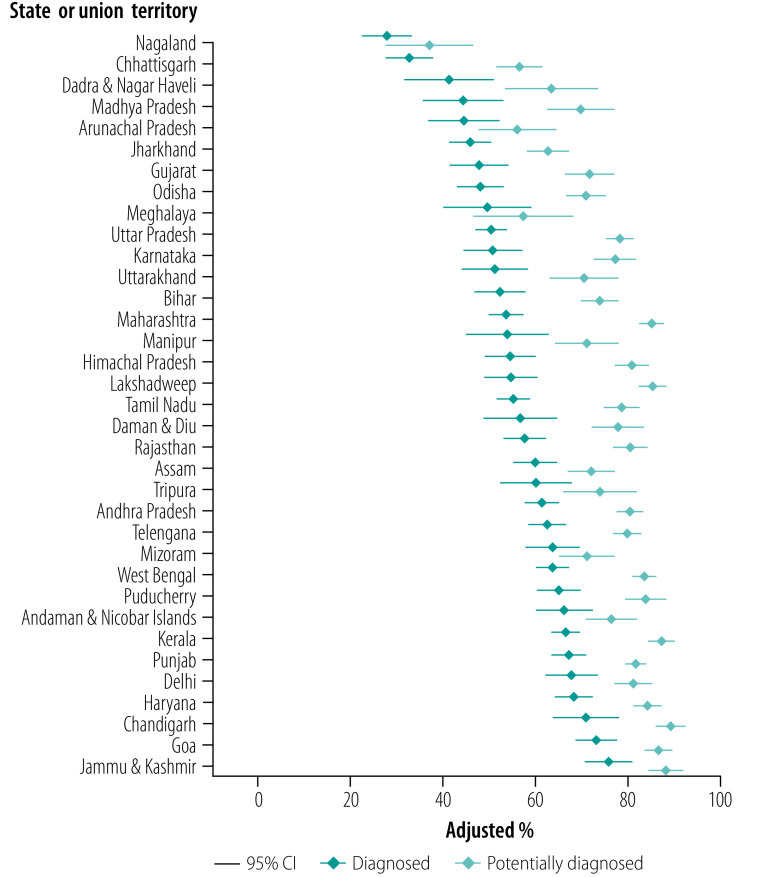
Fig. 2.
Adjusted percentage of adults aged 45 years and older with hypertension who were diagnosed and potentially diagnosed by state, India, 2017–2018
CI: confidence interval.
Notes: Adjusted for age and sex. Potentially diagnosed is the sum people actually diagnosed and those that could have been diagnosed had they not encountered a missed opportunity. Estimates and unadjusted estimates in table format available in data repository.25

