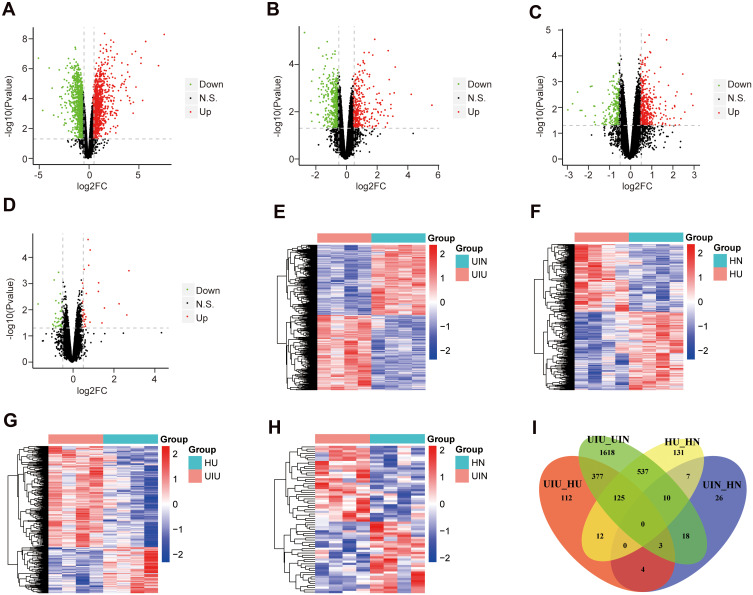
Figure 2.
Differentially expressed mRNAs. (A–D) The volcano plots of differentially expressed genes of four pairs of comparison, including UIU versus UIN, HU versus HN, UIU versus HU, UIN versus HN. The x-axis: log2FC value; the y-axis: −log10 (p-value); red: upregulation; green: downregulation; black: non-significant difference. (E–H) The expression level heat maps of differentially expressed genes of four pairs of comparison, including UIU versus UIN, HU versus HN, UIU versus HU, UIN versus HN. The x-axis: mRNA; the y-axis: sample; red: high expression; blue: low expression. (I) Venn diagram of differentially expressed genes.

