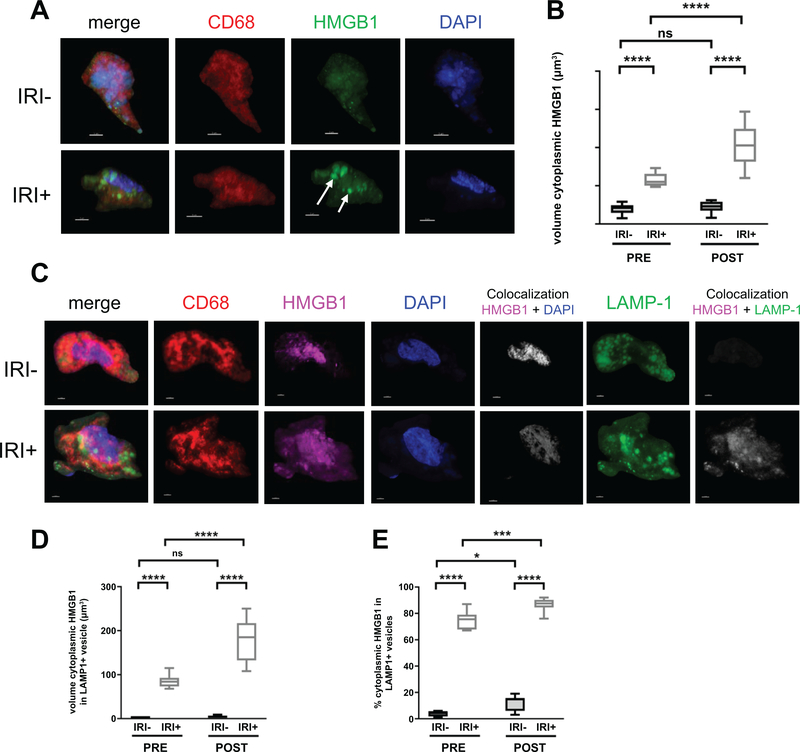
Figure 4. IRI+ biopsies contain disulfide-producing macrophages that increase over time.
Allograft biopsies were obtained 2 hrs pre-transplant (PRE) or 2 hrs post-reperfusion (POST), fixed in 4% PFA, sucrose-impregnated, embedded in gelatin then OCT blocks for immunofluorescence (IF). (A) 10 or 30um sections were stained for CD68 (red), HMGB1 (green) and counterstained with DAPI to detect cellular nuclei (blue). Scale bars = 3um. (B) Quantification of macrophage-specific cytoplasmic HMGB1 from reconstructed confocal laser-scanning microscopy Z-stacks as described in Fig. S4C, Sections were stained for CD68 (red), HMGB1 (pink), DAPI (blue), and LAMP1 (green). Localization of HMGB1 to the nuclear compartment (white, fifth panel of top and bottom rows) or LAMP1+ cytoplasmic vesicles (white, last panel of top and bottom rows) was determined using Imaris software. (D) Quantification of macrophage-specific cytoplasmic HMGB1 constrained within LAMP1+ vesicles by volume (um3). (E) Quantification of the percent of macrophage-specific cytoplasmic HMGB1 constrained within LAMP1+ vesicles. Numbers shown in B and D represent the average volume of HMGB1 found within the cytoplasm or LAMP1+ cytoplasmic vesicles of ≥3 randomly selected macrophages per patient for n=20 patients; IRI- = 10 and IRI+ = 10, Numbers shown in E represent the percent of cytoplasmic HMGB1 found within LAMP1+ vesicles of ≥3 macrophages per tissue slice for n=20 patients; IRI- = 10 and IRI+ = 10. *P < 0.05; Data are presented as Tukey box-and-whisker plots: whiskers are inner fences reaching 1.5 times the interquartile range and boxes represent the interquartile ranges, dots indicate outlying values and lines represent median values. *P < 0.05; ***P < 0.001; ****P < 0.0001 by two-way analysis of variance (ANOVA) with Sidak’s multiple comparisons test was used to determine differences amongst HMGB1 redox state and/or IRI status.

