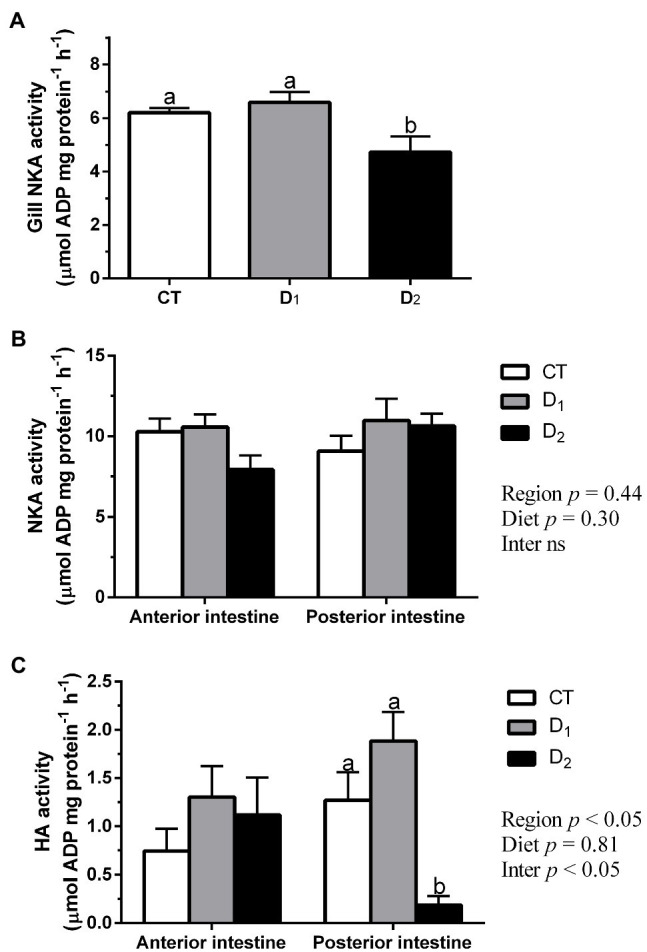
Figure 1.

Gill NKA activity (A), intestinal NKA activity (B), and intestinal HA activity (C) in S. aurata juveniles fed with different experimental diets (CT, control; D1, 1 mg-; and D2, 2 mg AFB1 kg−1 fish feed) for 85 days. Data are presented as mean ± SEM (n = 6–10). Different letters indicate significant differences among the same intestinal regions. Abbreviation “Inter ns”: interaction not significant (p < 0.05, one or two-way ANOVA followed by Tukey’s post hoc analysis).
