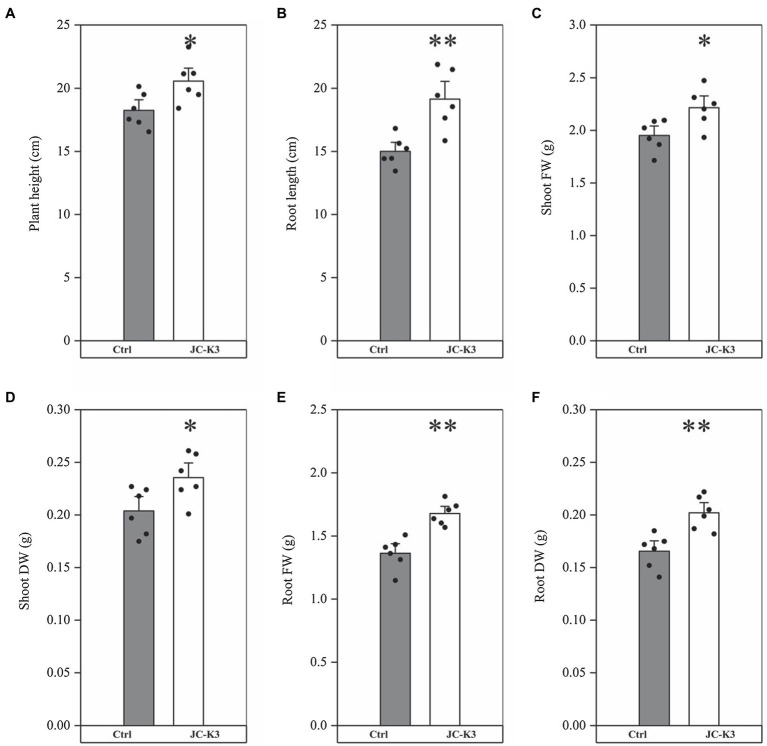
Figure 1.
Effect of inoculation of isolate JC-K3 on plant growth and biomass content; (A) Plant height, (B) Root length, (C) Shoot fresh weight, (D) Shoot dry weight, (E) Root fresh weight, and (F) Root dry weight. Each value is the average of six replicates. The error bar represents the SE, the average of six replicates. * on the bar chart of each treatment indicates the significant difference between the control group and the treatment group, *p < 0.05; **p < 0.01 (Student’s t-test). The black and white columns represent the control (Ctrl) and JC-K3 inoculated plants, respectively.

