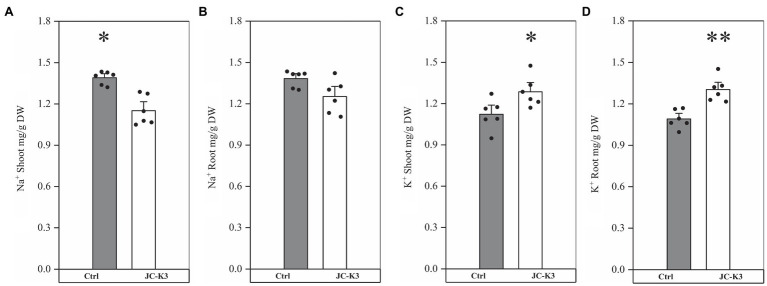
Figure 3.
Effect of inoculation of isolate JC-K3 on ionic uptake by plants. (A) Shoot Na+, (B) Root Na+, (C) Shoot K+, and (D) Root K+. Each value is the average of six replicates. The error bar represents the SE the average of six replicates. * on the bar chart of each treatment indicates the significant difference between the control group and the treatment group, *p < 0.05; **p < 0.01 (Student’s t-test). The black and white columns represent the control (Ctrl) and JC-K3 inoculated plants, respectively.

