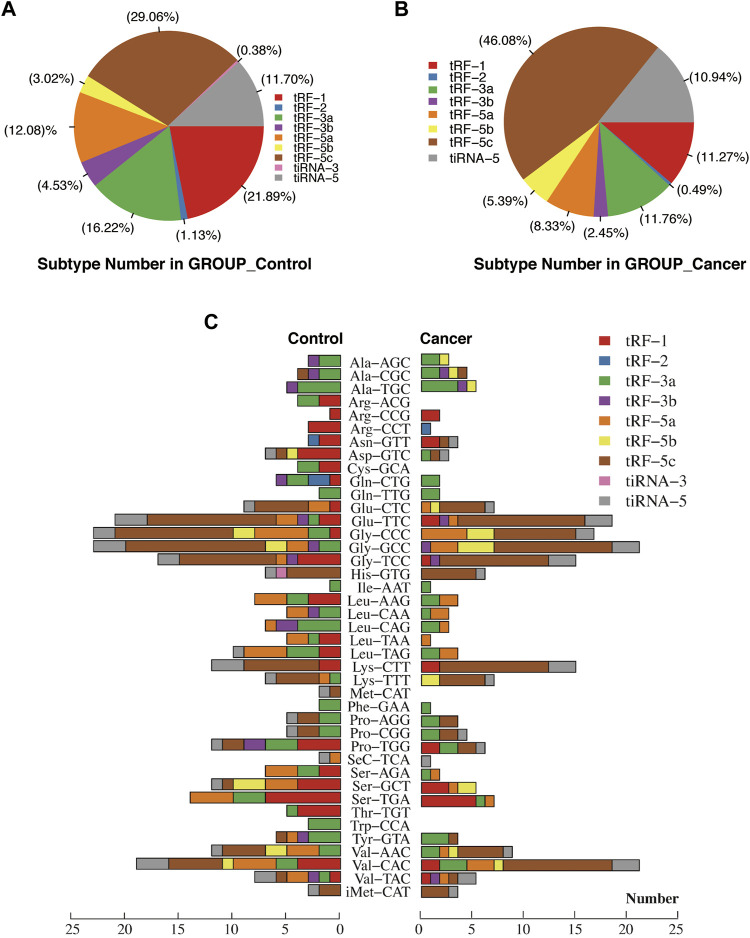
FIGURE 2.
Proportions of subtype tRFs and tiRNAs against tRNA isodecoders between healthy controls and nasopharyngeal carcinoma. (A) Proportions of tRF-1, tRF-2, tRF-3a, tRF-3b, tRF-5a, tRF-5b, tRF-5c, tiRNA-3, and tiRNA-5 in healthy controls. (B) Proportions of tRF-1, tRF-2, tRF-3a, tRF-3b, tRF-5a, tRF-5b, tRF-5c, and tiRNA-5 in nasopharyngeal carcinoma. (C) Stacked plot for all subtypes of tsRNAs between two groups clustering by the anticodon of the tRNAs. The X-axis represents the number of all subtype tsRNAs derived from the same anticodon tRNA, and the Y-axis shows the tRNAs with the same anticodon. The bar with color represents the number of each subtype of tsRNAs. Red, blue, green, purple, orange, yellow, and brown represent the subtypes of tRFs. Pink and gray represent the two subtypes of tiRNAs.

