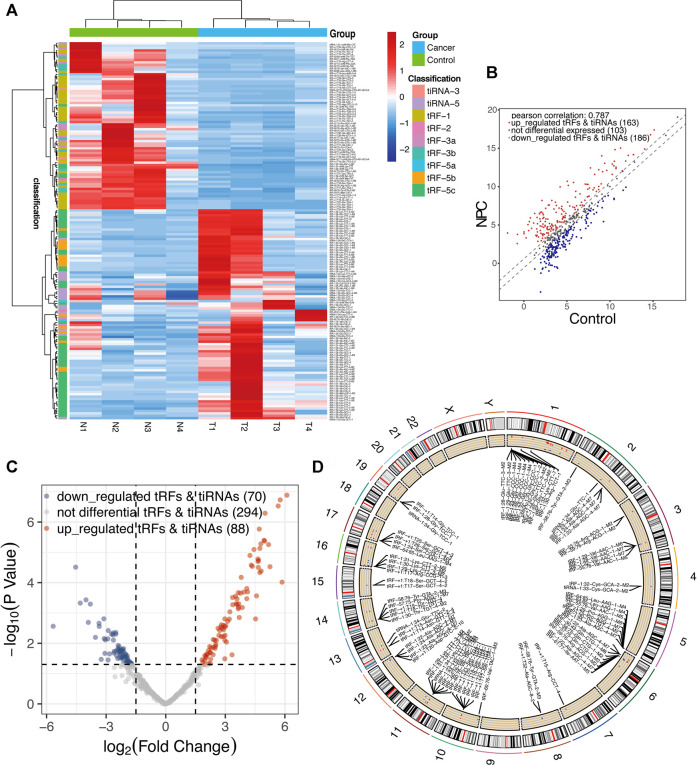
FIGURE 3.
Expression profiles of all aberrantly expressed tRFs/tiRNA sequencing data in nasopharyngeal carcinoma and healthy controls. (A) Expression heatmap of all aberrantly expressed tRFs/tiRNAs. (B) Scatter plot between two groups. CPM values of all tRFs and tiRNAs are plotted. The values of the X- and Y-axes in the scatter plot are the averaged CPM values of each group (log2 scaled). tRFs and tiRNAs above the top line (red dots, upregulation) or below the bottom line (blue dots, downregulation) indicate more than 1.5-fold change between two compared groups. Gray dots indicate non-differentially expressed tRFs and tiRNAs. (C) Volcano plot presents differential expression between the two groups. The values of the X- and Y-axes in the volcano plot are log2 transformed fold change and -log10 transformed p-values between the two groups, respectively. Red/blue circles indicate statistically significant differentially expressed tRFs and tiRNAs with a fold change of no less than 1.5 and p-value ⩽ 0.05 (red, upregulated; blue, downregulated). Gray circles indicate non-differentially expressed tRFs and tiRNAs, with FC and/or q-value that are not meeting the cut-off thresholds. (D) Circos plot of all differentially expressed tsRNAs on human chromosomes (visualize only part of the data).

