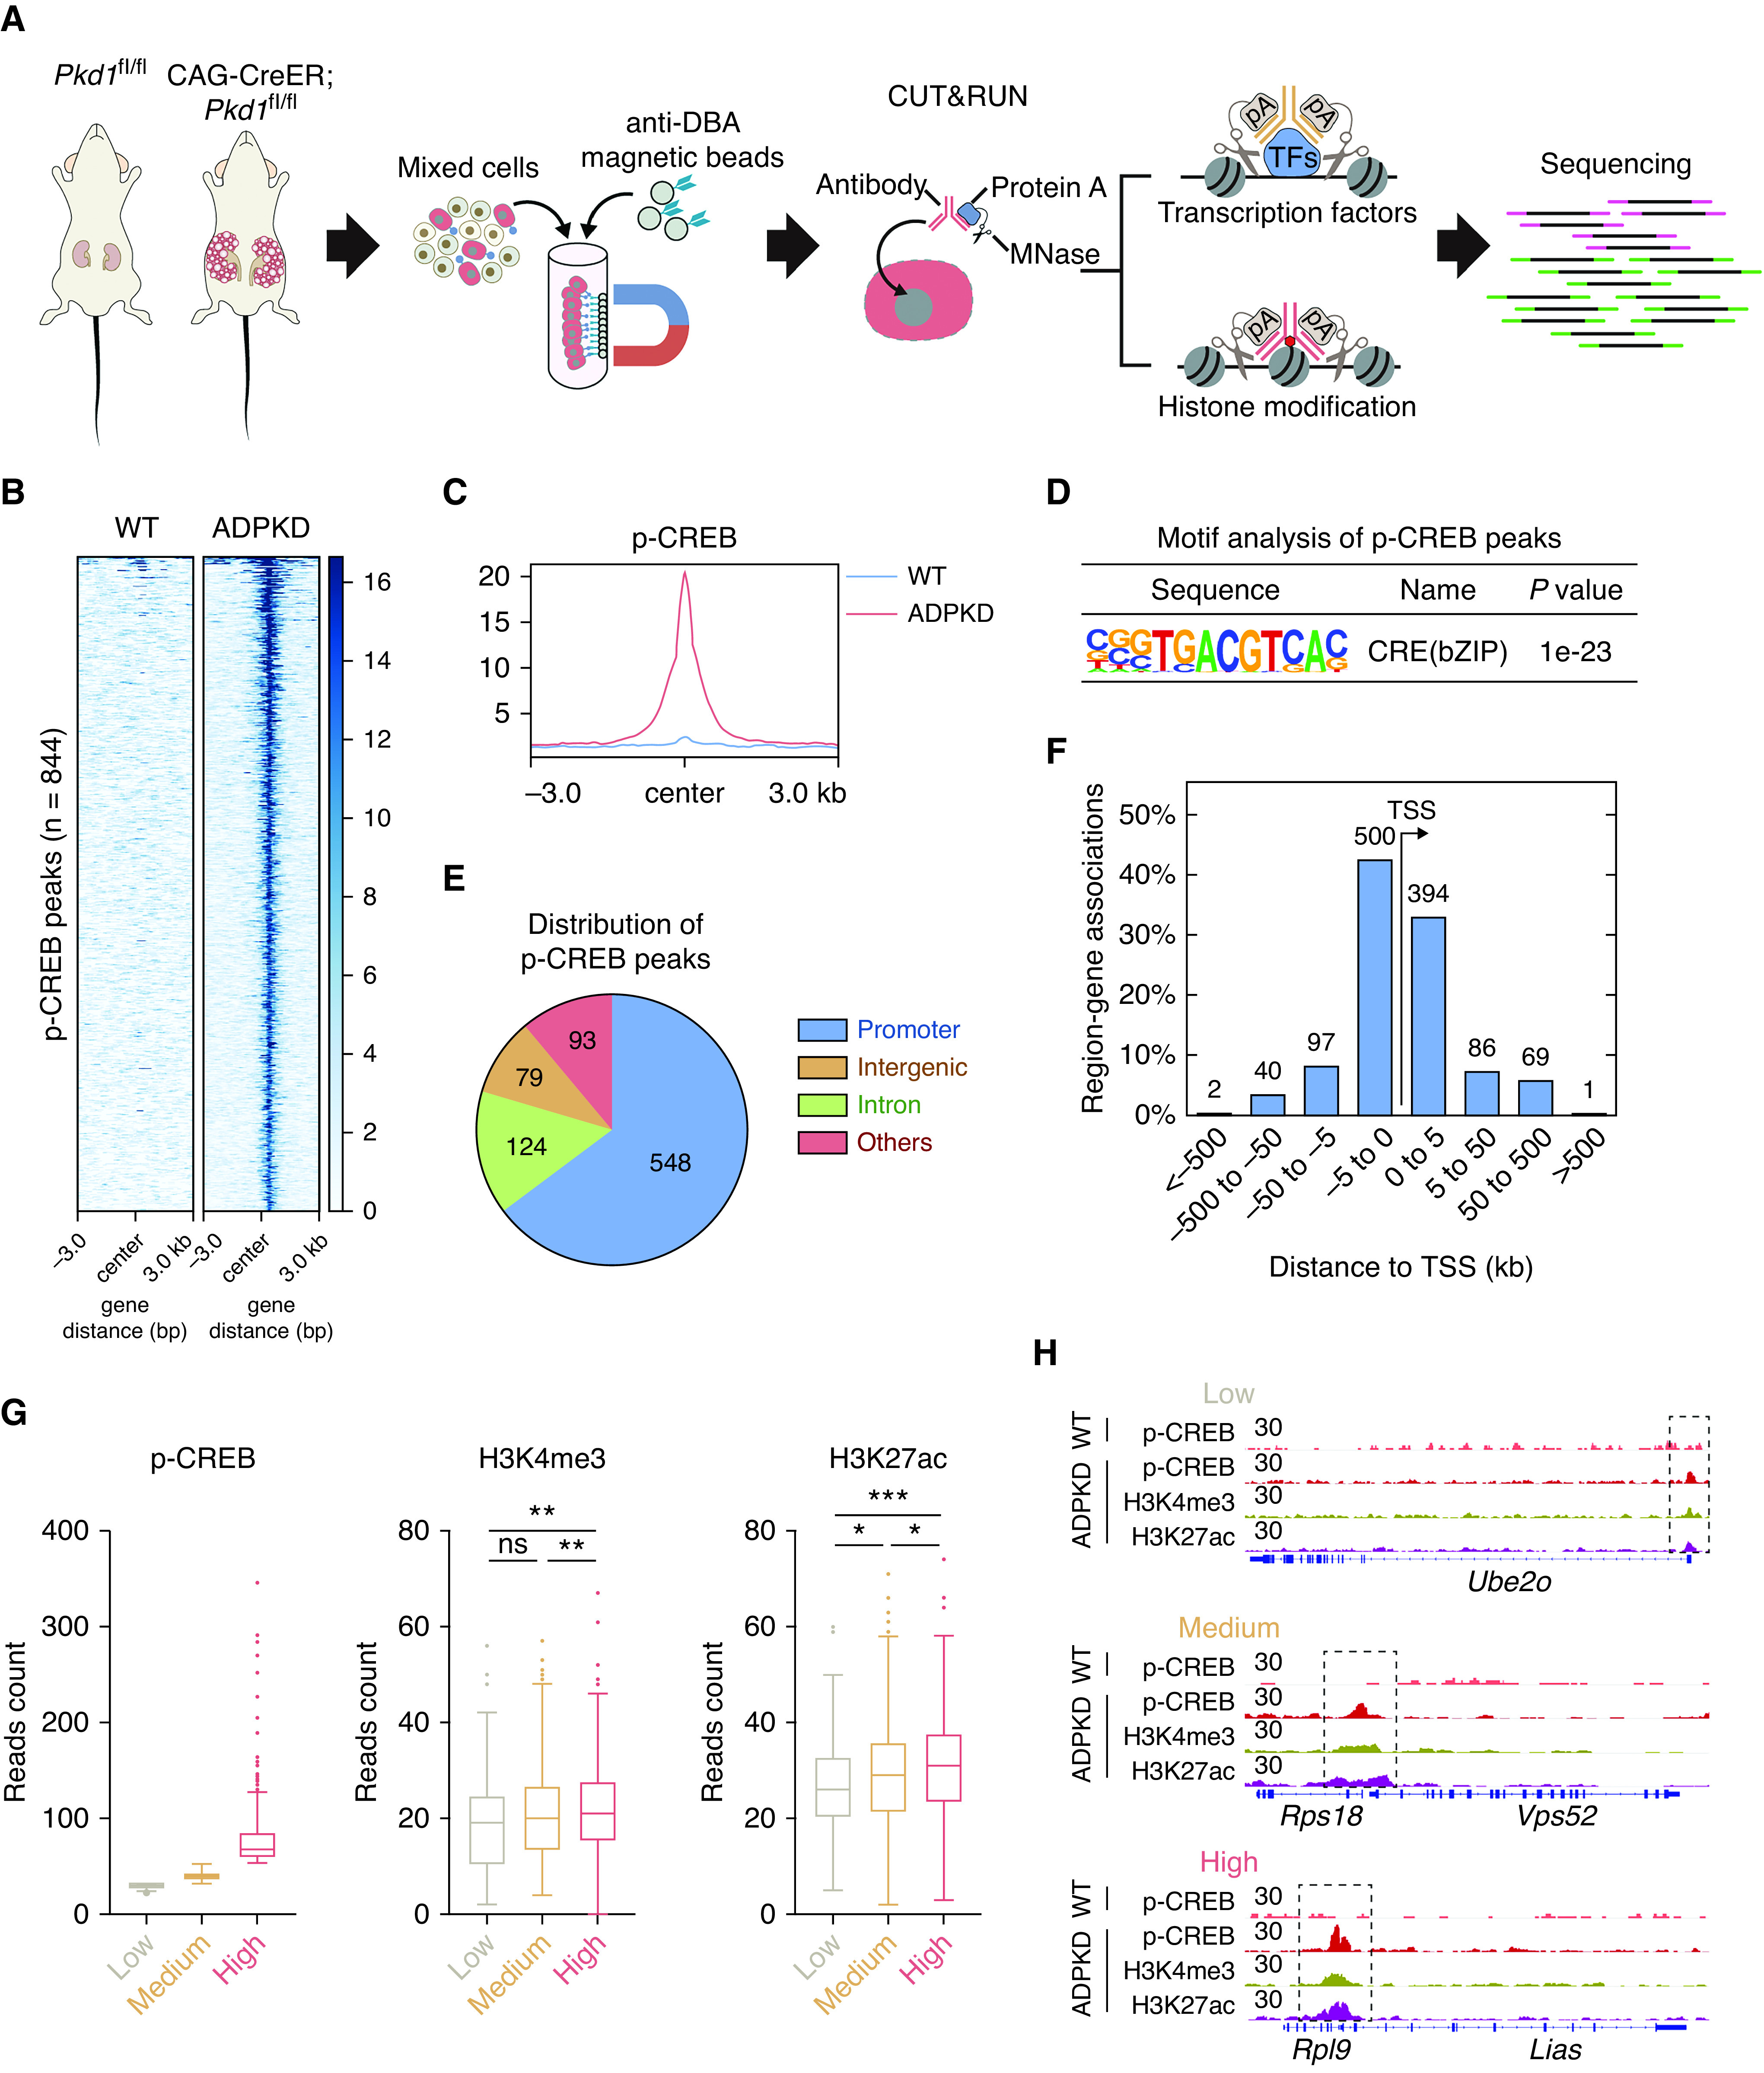
Figure 2.

Genomic profiling reveals that stronger p-CREB binding is associated with more active chromatin. (A) Schematic overview of genomic profiling of p-CREB and histone modifications by CUT&RUN followed by sequencing pA, protein A. An early-onset mouse (n=1) was used for the following analysis. (B) Heat map of normalized p-CREB signals in DBA-positive cells from WT and ADPKD mice. (C) Composite plots of normalized p-CREB signals in DBA-positive cells from WT and ADPKD mice. (D) Motif analysis of p-CREB peaks in DBA-positive cells from ADPKD mice. (E) Genomic distribution of p-CREB peaks in DBA-positive cells from ADPKD mice. (F) Number of genes around p-CREB peaks at different distances from adjacent transcription start site (TSS). (G) Box plots of p-CREB, H3K4me3, and H3K27ac reads in the indicated groups. Low, reads of p-CREB were <30; medium, reads of p-CREB were between 30 and 50; high, reads of p-CREB were >50. (H) Representative CUT&RUN tracks of p-CREB, H3K4me3, and H3K27ac in the indicated regions. Data were analyzed using the unpaired, two-sided t test. *P<0.05, **P<0.01, ***P<0.001. pA, protein A.
