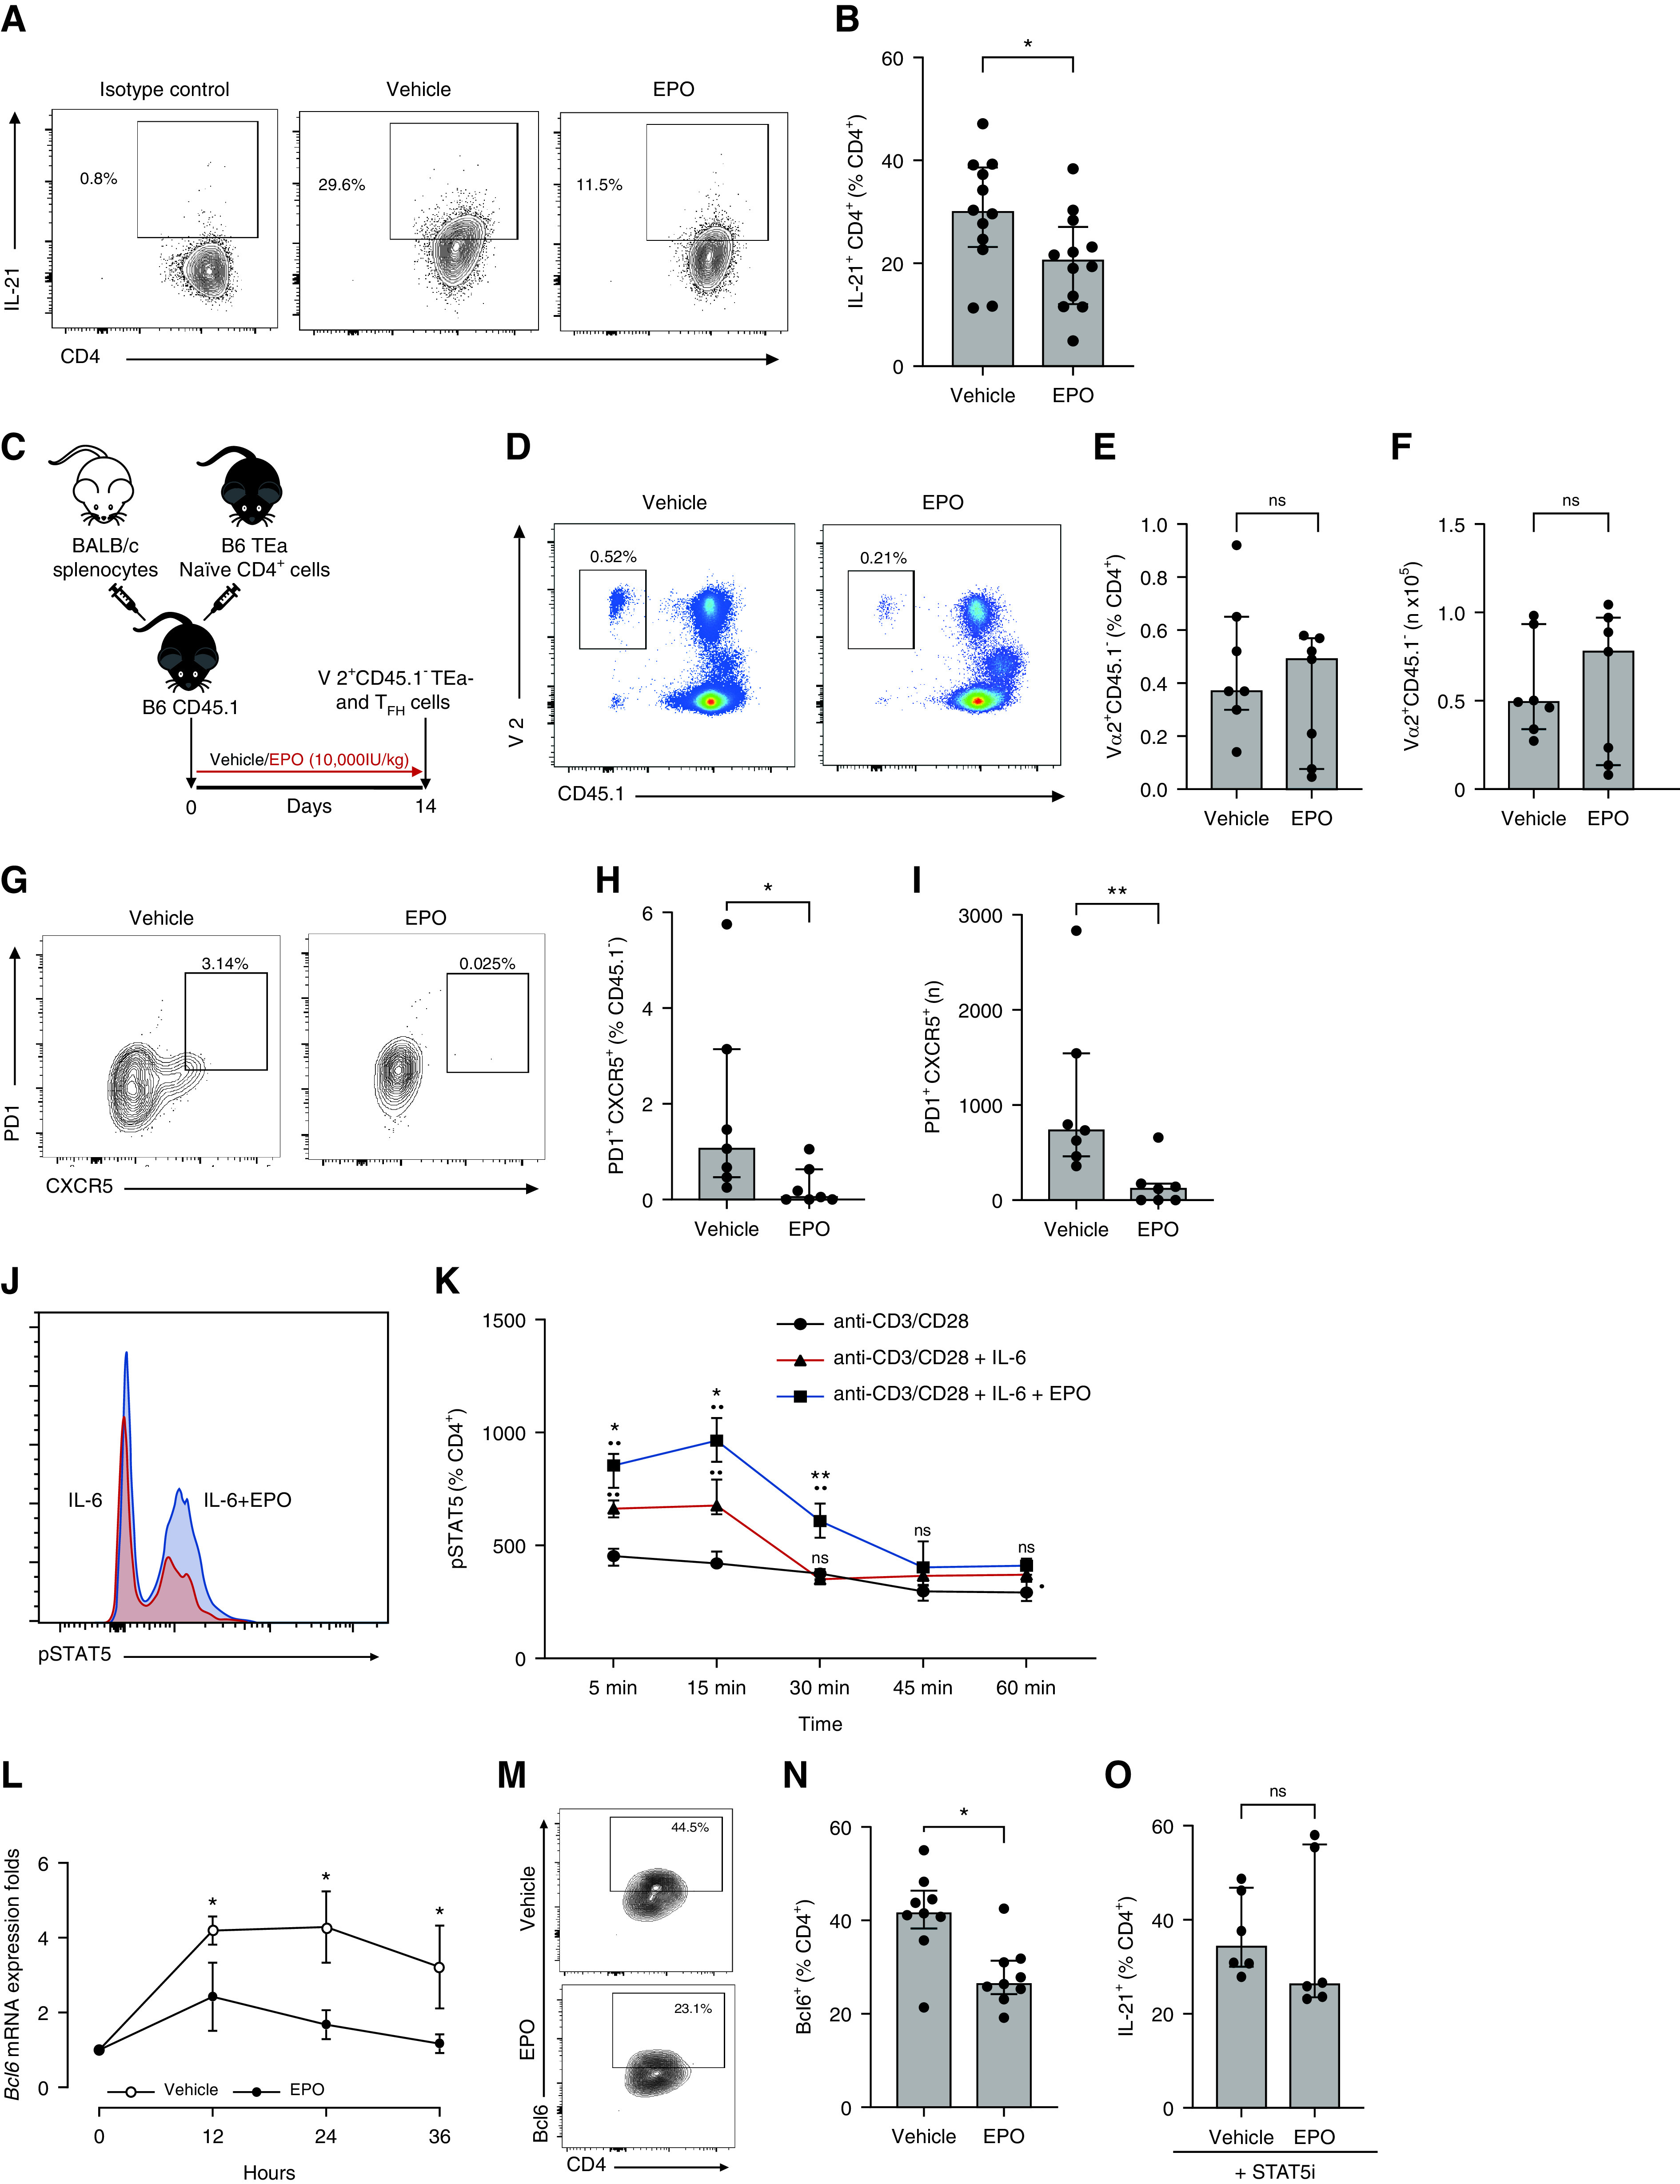
Figure 6.

EPO inhibits TFH induction in vitro and in vivo through a STAT5-mediated mechanism. Representative plots (A) for IL-21–producing CD4+ T cells and data quantification (B) of naïve B6 CD62LhiCD44loCD4+ T cells from WT B6 mice cultured under TFH cell–inducing conditions for 5 days in the presence or absence of EPO. Gate was positioned on the basis of isotype control. IL-21+ MFI for vehicle versus EPO: 1213.8±374 versus 901.5±288), *P=0.03; (C) Experimental design: CD4+Vα2+CD45.1- TEa cells were injected into congenic CD45.1 B6 mice, which were immunized with allogeneic BALB/c splenocytes, and treated for 14 days with EPO or vehicle control, then sacrificed. Representative plots (D) and data quantification (E), (F) for total Vα2+CD45.1- at sacrifice. Representative plots (G) and data quantification (H), (I) for CD45.1-PD1+CXCR5+Foxp3- TFH in the same mice. Representative flow plot (J) and data quantification (K) for CD4+pSTAT5+ T cells from WT B6 mice cultured under TFH cell–inducing conditions for 5 days in presence or absence of EPO. Data are from five independent experiments with different donors (median±IQR) *P<0.01 **P<0.0001: the black dot (•) shows comparison versus anti-CD3/CD28 stimulation, asterisk (*) comparison between anti-CD3/CD28 + IL-6 and anti-CD3/CD28 + IL-6 + EPO at the same time point (two-way ANOVA). Time course of Bcl6 gene expression in naïve B6 CD62LhiCD44loCD4+ T cells from WT B6 mice cultured under TFH cell–inducing conditions for 5 days in the presence or absence of EPO (L). Representative plots (M) and data quantification (N) for CD4+BCL6+ T cells from WT B6 mice cultured under TFH cell–inducing conditions for 2 days in presence or absence of EPO. The same quantification at day 0 resulted in absence of Bcl6 (not shown). Data quantification (O) of naïve B6 CD62LhiCD44loCD4+ T cells from WT B6 mice cultured under TFH cell–inducing conditions for 5 days in the presence of a STAT5 inhibitor (STAT5i) and with or without EPO. Each dot represents a different culture well. Data represent median±IQR. *P<0.05, **P<0.01. Data were analyzed using unpaired Mann–Whitney test.
