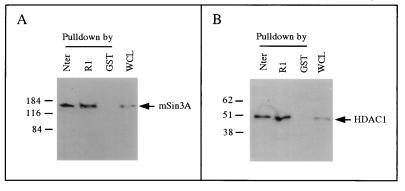
FIG. 2.
Interaction of TIEG2 and mSin3A in vitro. (A) A GST pulldown assay using GST fusion proteins and unlabeled CHO cell extracts combined with Western blot analysis was used to analyze TIEG2-interacting proteins. The anti-mSin3A antibody recognizes a single band of approximately 160 kDa (arrow) in complexes pulled down by GST-R1 and GST-Nter but not by GST alone. As a control, a band of the same size is also observed in whole-cell lysate (WCL; 20 μg per lane) prior to pulldown. (B) The pulled-down complexes were also subjected to Western blot analysis using anti-HDAC1 antibody. The antibody recognizes a single band of approximately 50 kDa (arrow) in complexes pulled down by GST-R1 and GST-Nter, but not by GST alone, which is consistent with the size of HDAC1. As a control, a band of the same size is also observed in whole-cell lysate (20 μg per lane) prior to pulldown. The values on the left are molecular sizes in kilodaltons.

