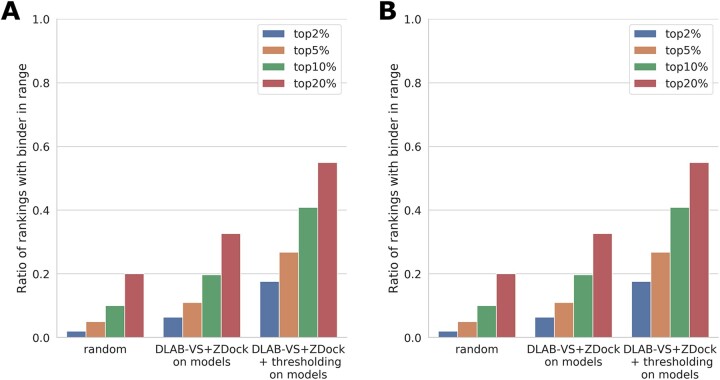
Fig. 2.
DLAB-VS and ZDock binder classification performance. For each approach, the ratio of pairings for which the binding antibody was ranked in the top 2%, top 5%, top 10% and top 20% respectively is shown. (A) Comparison of the performance of ZDock and DLAB-VS binder classification on the model dataset to the random expectation (‘random’) of finding the binder in the top N%. Using the combination of DLAB-VS and ZDock scores (‘DLAB-VS+ZDock’) detailed in Section 3 and supplementing it with the DLAB-Re-max thresholding (‘DLAB-VS+ZDock + thresholding’), the classification performance on the model dataset can be improved significantly. (B) Performance on the post-snapshot model dataset after removing any CDR sequences with overlap to the model dataset (at 90% CDR sequence identity as defined above) both without (‘DLAB-VS+ZDock’) and with (‘DLAB-VS+ZDock + thresholding’) DLAB-Re-max score thresholding. Performance for the CDR sequences clustering with sequences in the model dataset is shown in Supplementary Figure S12

