
Fig. 4.
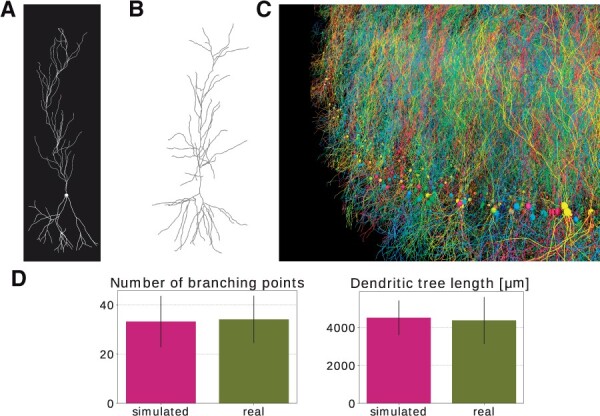
Pyramidal cell simulation. (A) Example pyramidal cell simulated with BioDynaMo. (B) Real neuron (R67nr67b-CEL1.CNG) taken from Mellström et al. (2016) and visualized with https://neuroinformatics.nl/HBP/morphology-viewer/. (C) Large-scale simulation. The model started with 5000 initial pyramidal cell bodies and contained 9 million agents after simulating 500 iterations. The simulation execution time was 35 s on a server with 72 CPU cores. (D) Morphology comparison between simulated neurons and experimental data from Mellström et al. (2016). Error bars represent the standard deviation. (A, C) A video is available in the Supplementary Materials