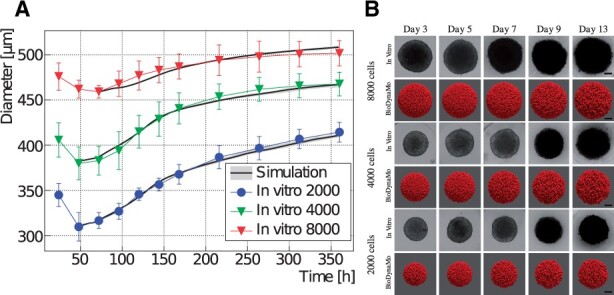
Fig. 5.

Comparison between in vitro MCF-7 tumor spheroid experiments and our in silico simulations using BioDynaMo. (A) Human breast adenocarcinoma tumor spheroid (MCF-7 cell line) development during a 15 day period, where different initial cell populations were considered [see Fig. 3 in Gong et al. (2015)]. Error bars denote standard deviation to the experimental data. The mean of the in silico results is shown as a solid black line with a gray band depicting minimum and maximum observed value. (B) A qualitative comparison between the microscopy images and simulation snapshots. Scale bars correspond to 100 μm. A video is available in the Supplementary Materials
