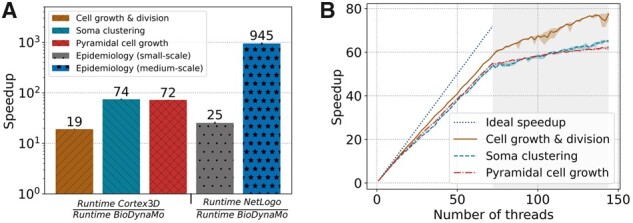
Fig. 7.

BioDynaMo performance analysis. (A) Speedup of BioDynaMo compared to the serial simulation platforms Cortex3D and NetLogo. Simulations use one CPU core except for the ‘epidemiology (medium-scale)’ benchmark, for which all 72 physical cores were available. The comparison with NetLogo uses the same simulation with different numbers of agents. Cortex3D supports only small-scale simulations. (B) Strong scaling behavior of BioDynaMo on a server with 72 physical cores, two threads per core and four NUMA domains. The gray area highlights hyper-threads
