Fig. 3.

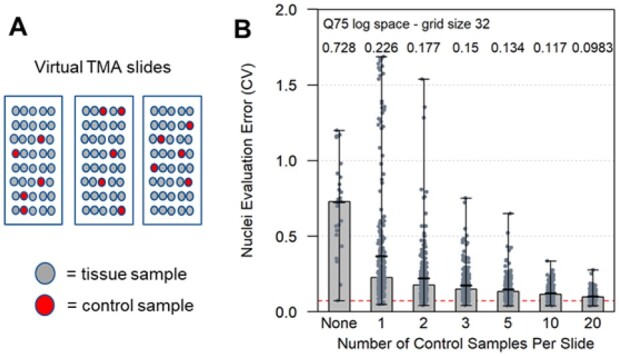
The effect of control sample number on error correction of TMA slide images. A limited number (1, 2, 3, 4, 10 or 20) of control samples and their images were used to normalize virtual TMA slide images. Each normalization was performed 10 times in which TMA samples were randomly selected and used as controls for normalization. The random selection of control samples for each virtual slide was constrained such that a randomly selected sample used as a control on one virtual TMA slide could not be selected and used as a control on any other virtual slide. An example is illustrated (A) in which five control samples are randomly selected from three virtual TMA slides. The bar chart (B) presents the performance of applying the Q75 normalization method in log space to the grid objects of size 32 from the control samples on each virtual slide. After normalizing the images, the evaluation of nuclei objects across all 85 samples from the virtual TMA slides was used to compute the MEO CVs. The computed performance was based on 27 testing scenarios that involved either 2 or 3 virtual slides. The ‘None’ case (left most bar) is the uncorrected data with a median value of 0.728. This value is slightly different than the uncorrected data presented in Figure 2 that included two additional test scenarios. The horizontal red dashed line is located at 0.0738 in the bar chart
