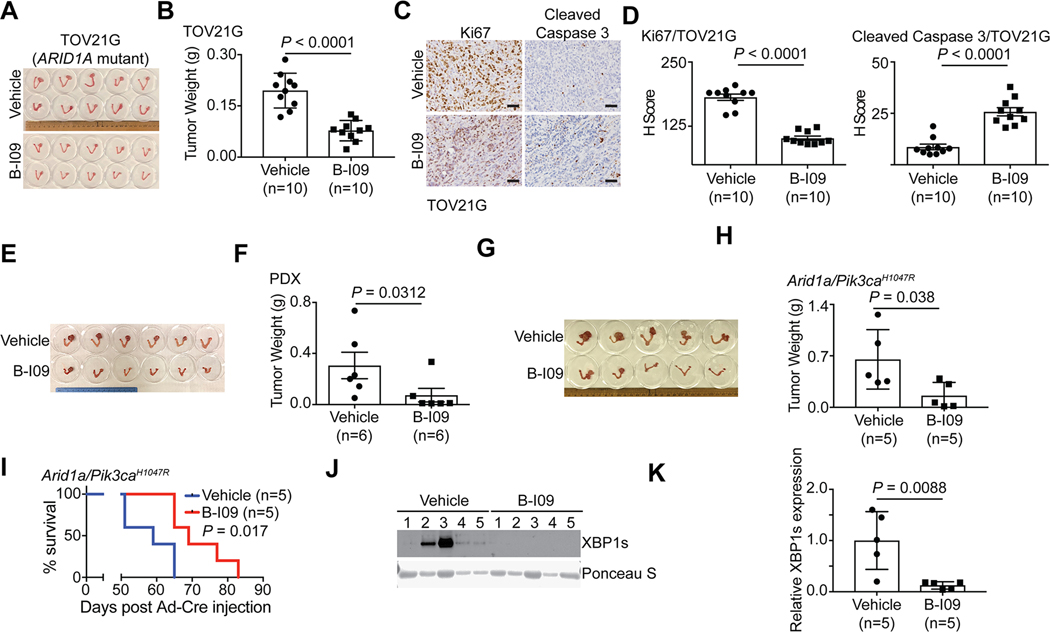
Figure 5: B-I09 is effective against ARID1A-inactivated OCCCs.
(A-D) Orthotopic xenografts formed by ARID1A-mutated TOV21G cells treated with vehicle or B-I09. Shown are images of reproductive tracks with tumors from indicated groups (A). Tumor weight was measured as surrogate for tumor burden (n = 10 mice per group) (B). Dissected tumors from the indicated treatment groups were subjected to immunohistochemical (IHC) staining for cell proliferation marker Ki67 or apoptosis marker cleaved caspase 3 on serial sections (C), and the histological scores (H-score) of indicated markers was quantified in each of the indicated treatment groups (D). Scale bar = 100 μm. (E-F) Mice bearing ARID1A-mutated OCCC PDXs were treated with vehicle or B-I09 (n = 6 mice per group). Shown are images of reproductive tracks with tumors from the indicated groups at end of treatments (E). Tumor weight was measured as a surrogate for tumor burden (F). (G-K) Mice bearing OCCC developed from the genetic Arid1a−/−/Pik3caH1047R model were treated with vehicle or B-I09 (n = 5 mice per group). Shown is an image of reproductive tracks with tumors from the indicated groups at the end of treatments (G). Tumor weight was measured as a surrogate for tumor burden (H). After stopping the treatment, mice from the indicated treatment groups were followed for survival by the Kaplan-Meier methods (n = 5 mice per group) (I). Expression of spliced XBP1 (XBP1s) in tumors from the indicated treatment groups was determined by immunoblot. A non-specific band revealed by Ponceau S staining was used as a loading control (J). The relative XBP1s expression was quantified based on intensity of immunoblot bands normalized against loading controls using NIH ImageJ software (K). P values were calculated using two-tailed Student’s t-test except by log-rank test in I. Error bars represent mean with SD.

