Figure 4.

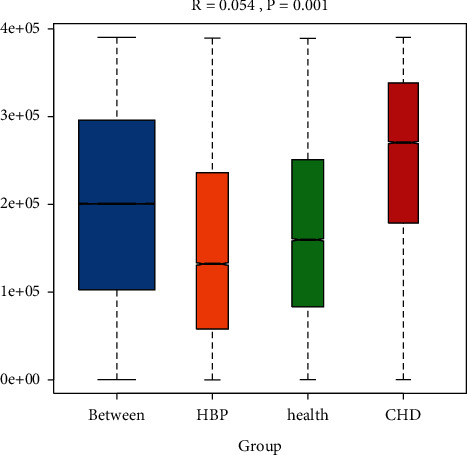
Analysis of similarities (ANOSIM) among the three groups (the range of R is [−1, 1]. R > 0 indicates that the difference between groups is greater than that within groups. P value can be obtained by the permutation test).

Analysis of similarities (ANOSIM) among the three groups (the range of R is [−1, 1]. R > 0 indicates that the difference between groups is greater than that within groups. P value can be obtained by the permutation test).