
Fig. 1.
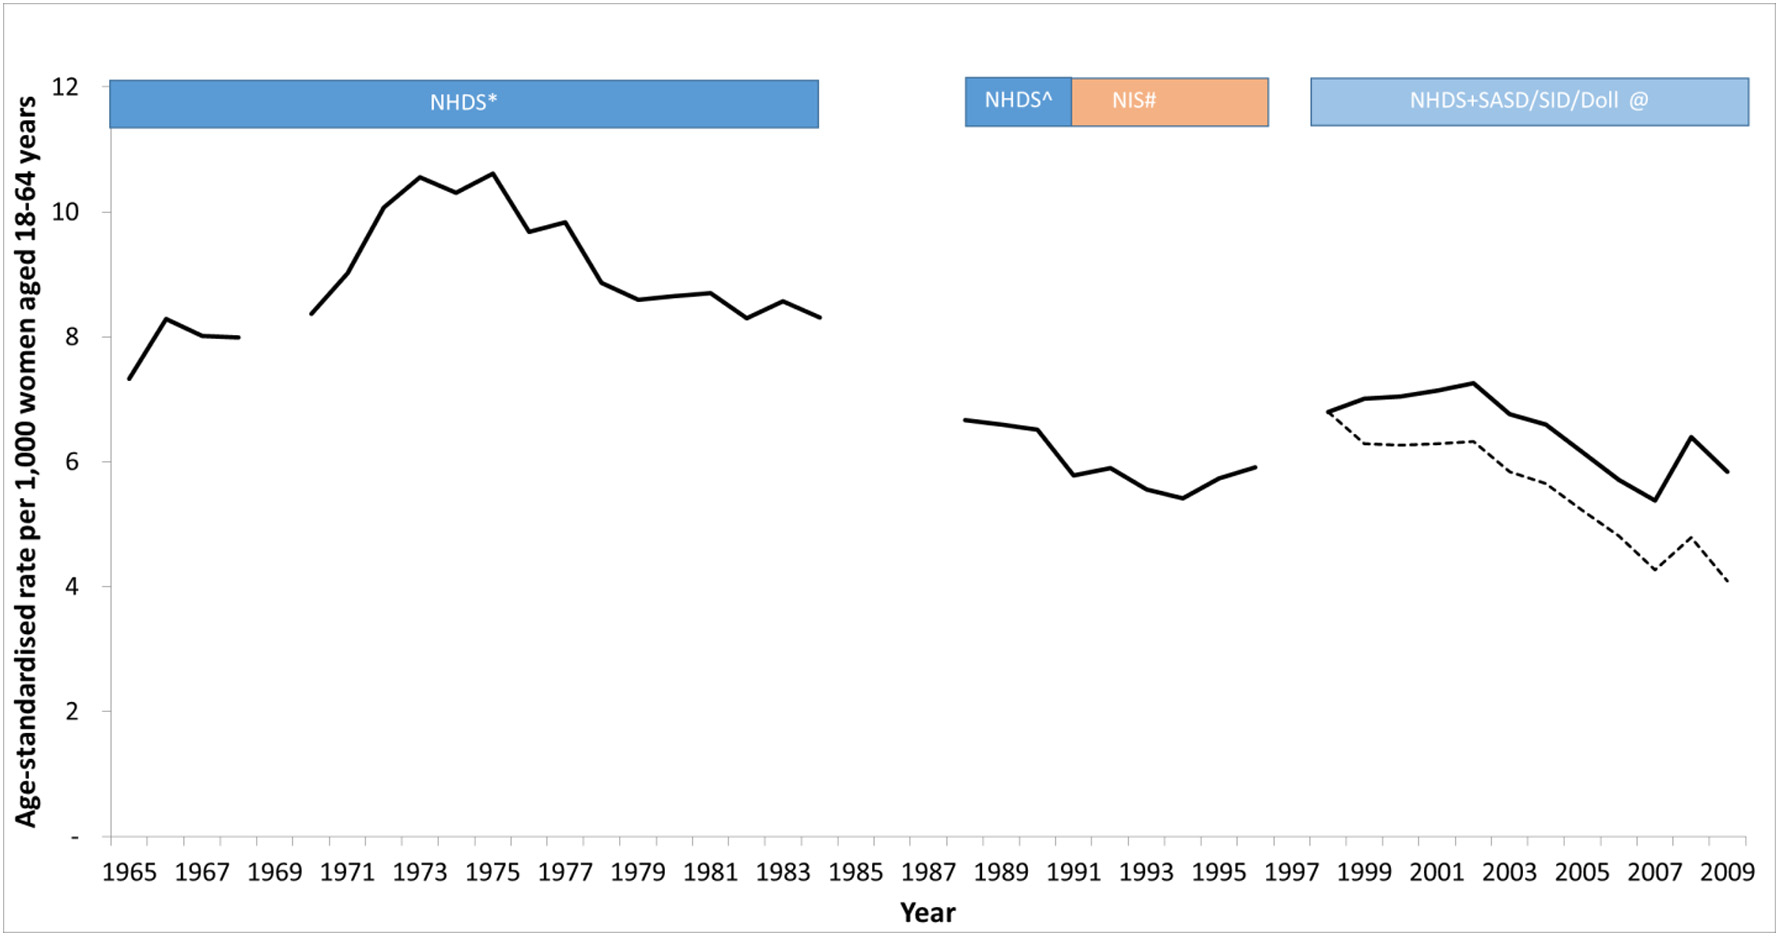
Reported hysterectomy incidence rates (both subtotal and cervix-removing procedures) per 1000 women aged 18–64 years in USA. Data were obtained from analysis of national inpatient datasets from 1965 to 2009. For 2000–2009, the crude reported data from inpatient procedures is shown as the dashed black curve, and the scaled hysterectomy incidence rate after accounting for the under-reported proportion of outpatient procedures is shown as the solid black curve. *Obtained from published rates [22] reported by 5-year age-group and for each individual year from 1965 to 1984 but missing the year 1969. Ôbtained from published rates [23] reported over ages 15+ as one group and across years 1988–1990 as one group. We re-scaled the rates to represent rates for females aged 18–64 (with the assumption that all hysterectomy procedures were performed in this age-range) and assumed that the same number of procedures occurred over the period 1988–1990 each year. #Obtained from published rates [5] reported over ages 15+ as one age-group and for each individual year from 1990 to 1997. We re-scaled the rates to represent rates for females aged 18–64 (with the assumption that all hysterectomy procedures were performed in this age-range). @Obtained from publicly available datasets [27] reported for each year-of-age from 15 to 99 and for each individual year from 1998 to 2009. Raw hysterectomy incidence rates were obtained for inpatient procedures only, and these raw rates are shown as the dashed black curve for 2000–2009. Hysterectomy rates were further adjusted to account for the unreported proportion of hysterectomies that are performed in an outpatient setting, and these corrected rates are shown as the solid black curve.