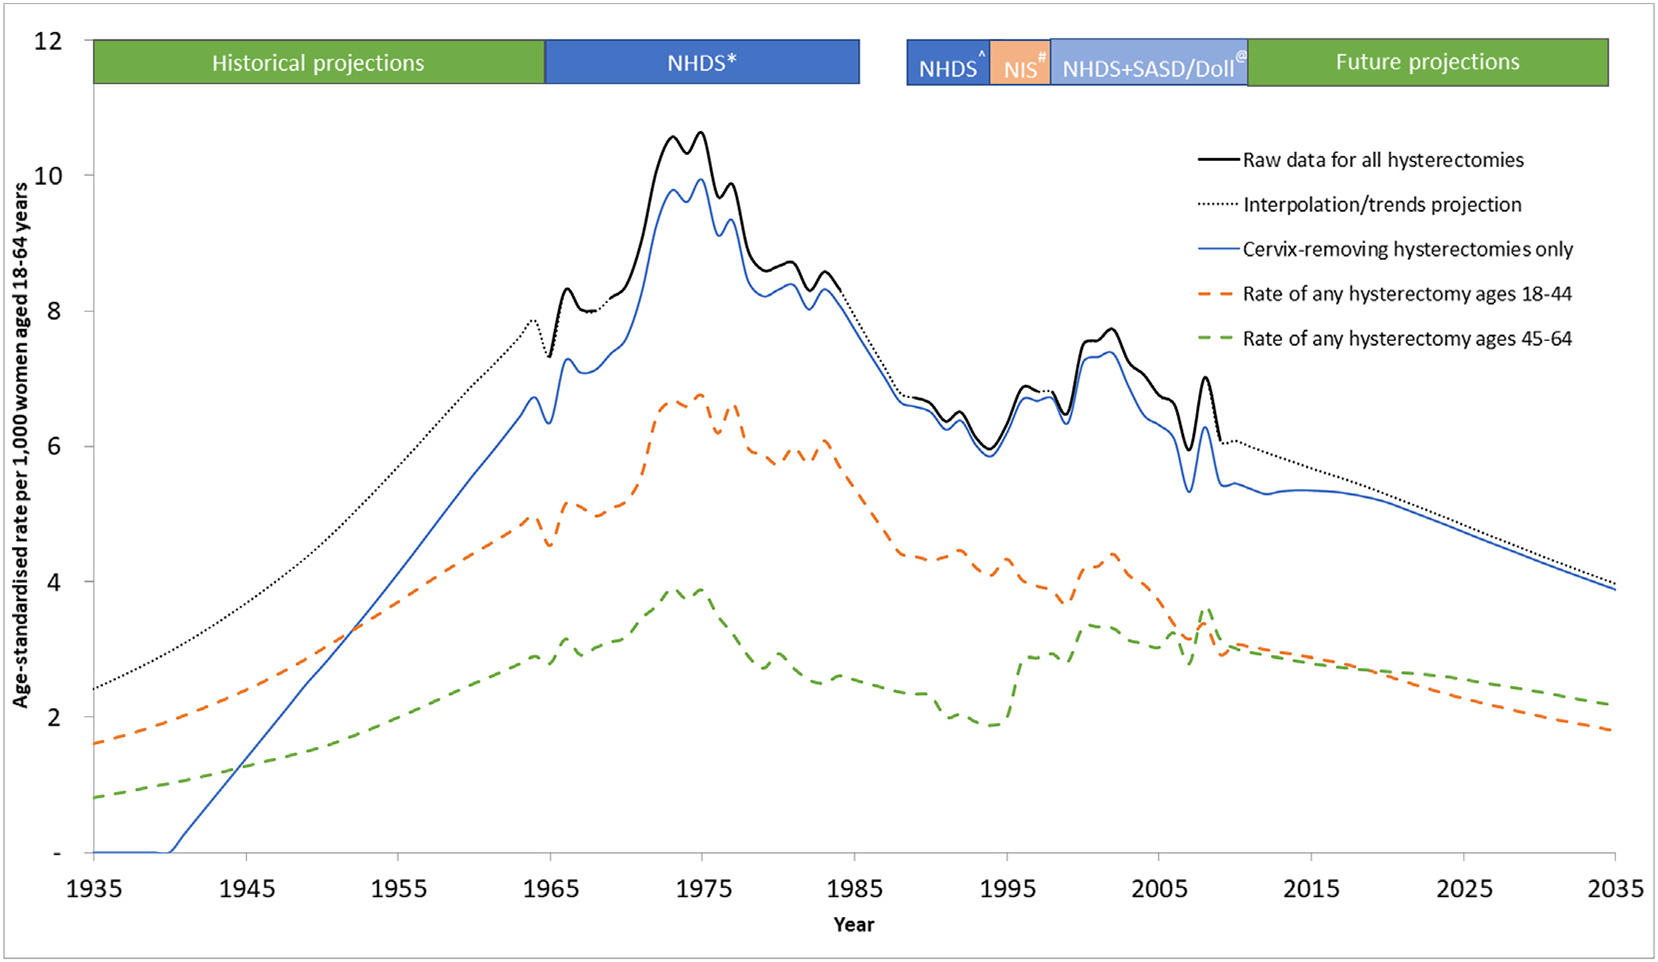
Fig. 2.

Estimated incidence rate of hysterectomy procedures (both subtotal and cervix-removing procedures) per 1000 women aged 18–64 years in USA from 1935 to 2035^^ ^^ Rates for all hysterectomies are shown as the combined black-solid (real-world informed) and black-dashed (interpolated/trends projection) line. The national datasets used to inform the real-world data segments are listed in the coloured region above the graph. Hysterectomy procedures that are cervix-removing are shown on the graph in the blue solid line. Hysterectomy procedures of any type in females aged 18–44 and 44–64 are shown as the dashed orange and dashed green lines respectively. *Obtained from published rates [28] reported by 5-year age-group and for each individual year from 1965 to 1984, but missing the year 1969. Ôbtained from published rates [29] reported over ages 15+ as one group and across years 1988–1990 as one group. We re-scaled the rates to represent rates for females aged 18–64 (with the assumption that all hysterectomy procedures were performed in this age-range) and assumed that the same number of procedures occurred over the period 1988–1990 each year. #Obtained from published rates [3] reported over ages 15+ as one group and for each individual year from 1990 to 1997. We re-scaled the rates to represent rates for females aged 18–64 (with the assumption that all hysterectomy procedures were performed in this age-range). @Obtained from the publicly available datasets [27] reported for each year-of-age from 15 to 99 and for each individual year from 1998 to 2009. Hysterectomy rates were further adjusted to account for the unreported proportion of hysterectomies that are performed in an outpatient setting.
