Fig. 4.


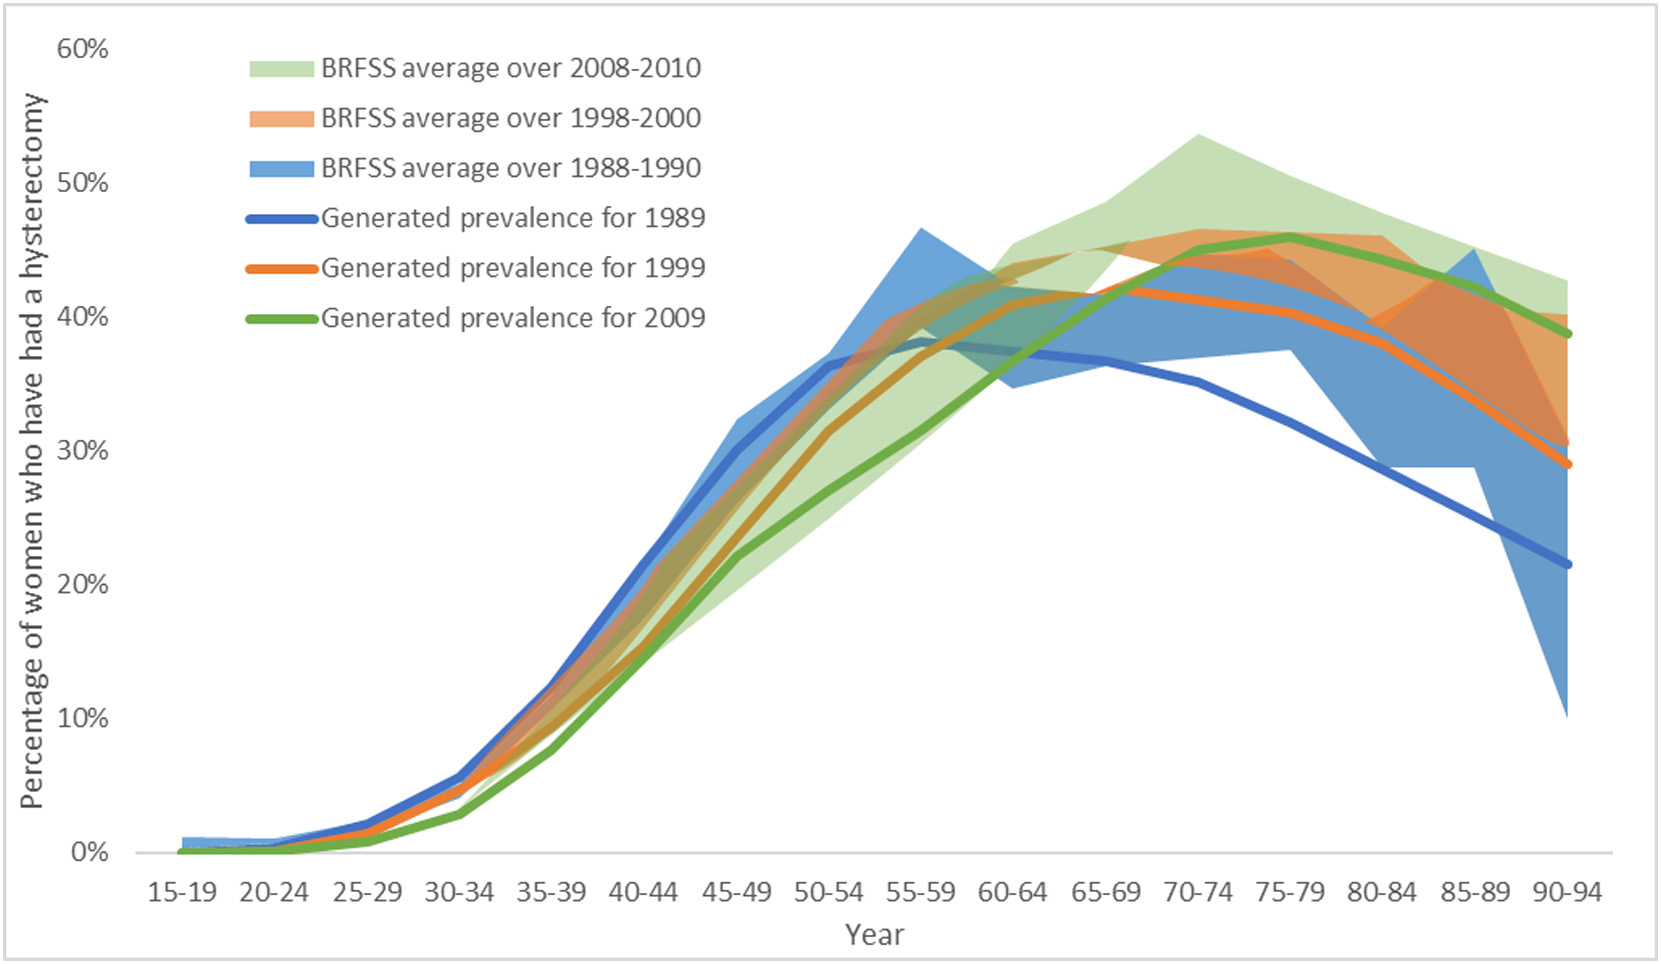
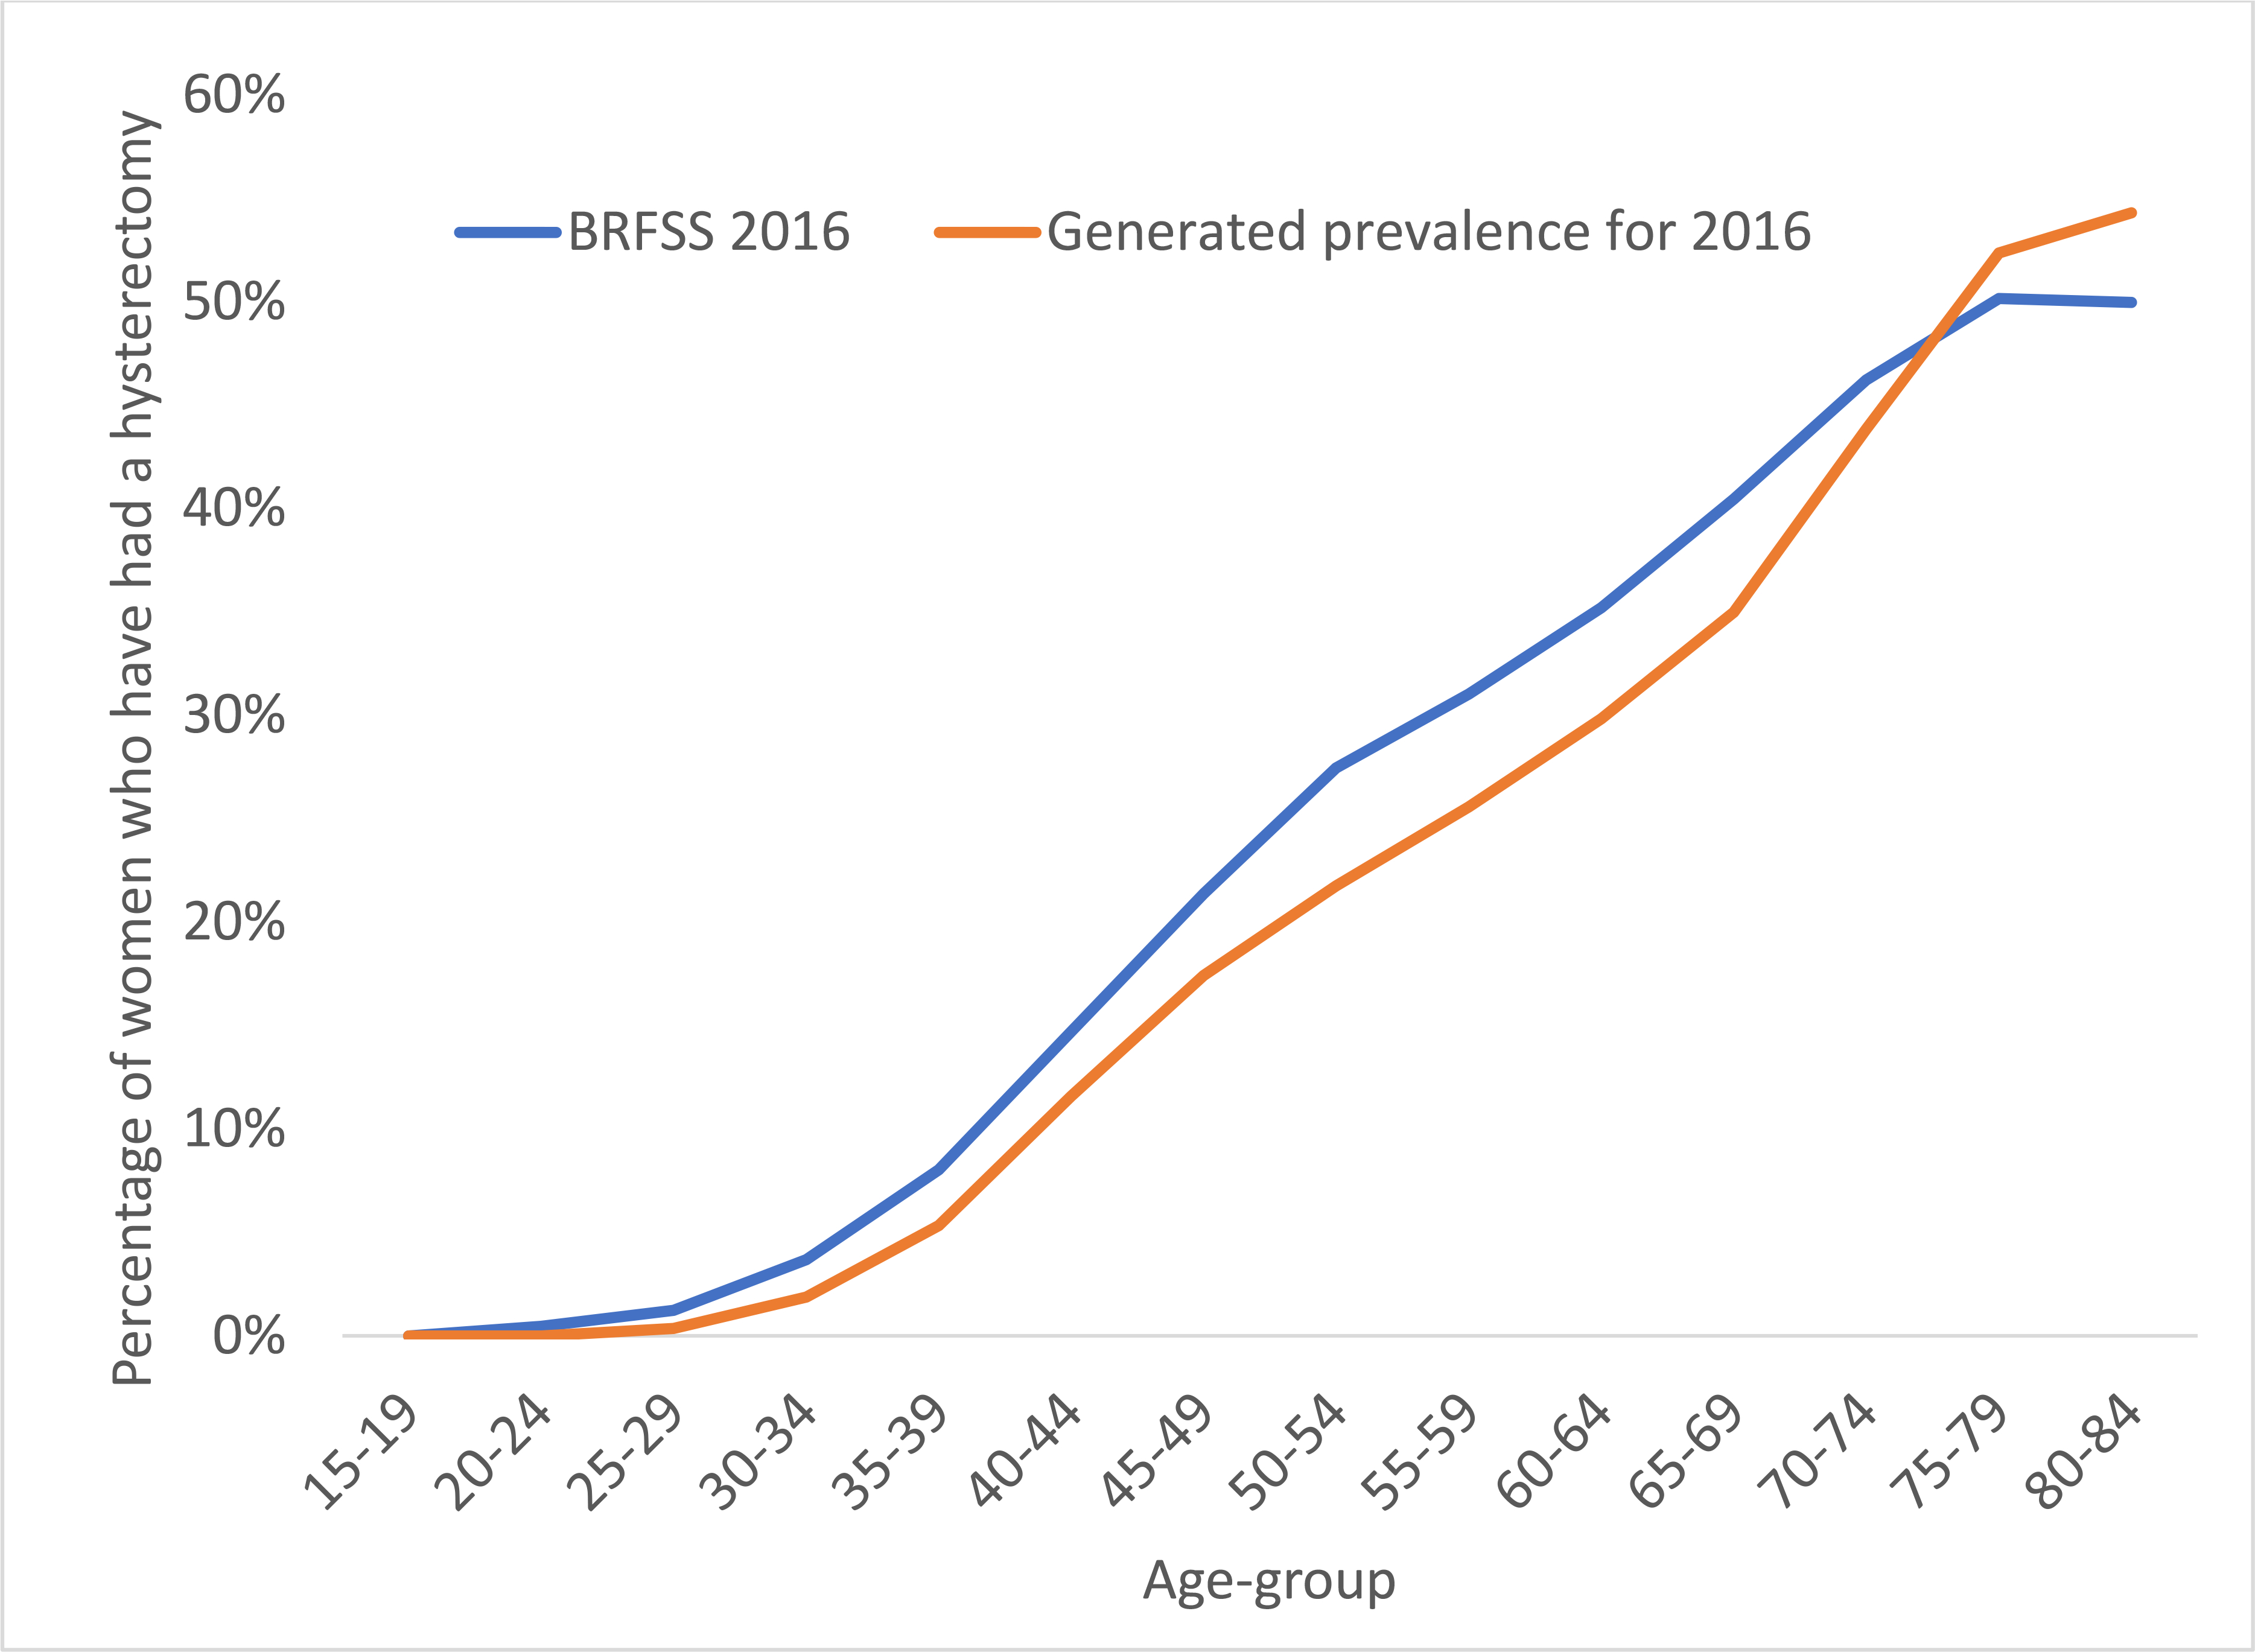
Age-specific hysterectomy prevalence estimates (including subtotal and cervix-removing procedures) as reported by BRFSS (a) for the years shown in shaded regions for 1988–1990 (blue), 1998–2000 (orange) and 2008–2010 (green), and (b) for the year 2016. Estimated historical hysterectomy incidence rates were used to produce cross-sectional prevalence, shown as the solid lines for years 1998 (blue), 1999 (orange) and 2009 (green).
