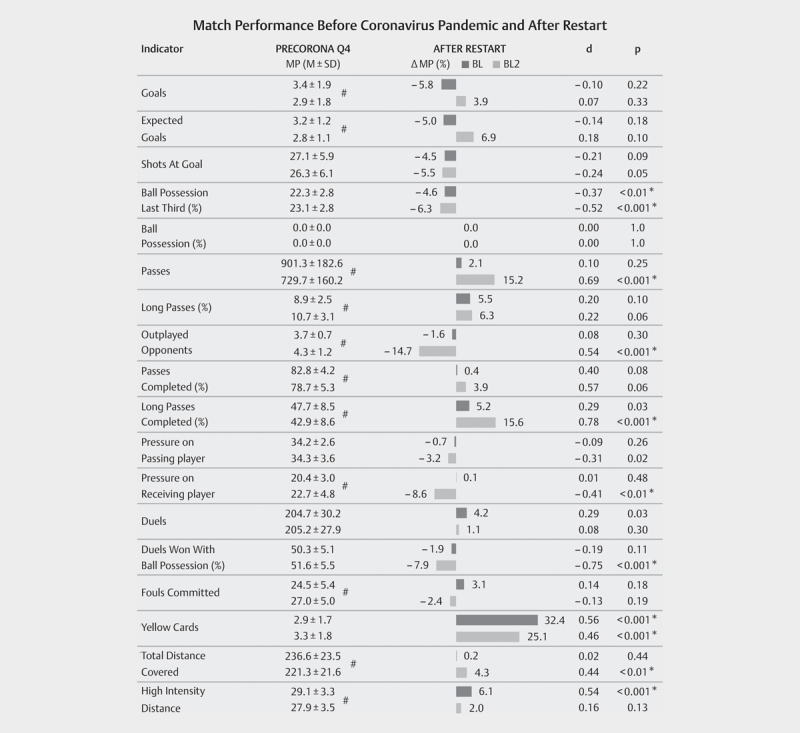
Fig. 1.

Effects of corona-specific playing conditions on match performance. Columns report match performance (MP) per indicators in sample PRECORONA Q4 and their changes (ΔMP) (in %) in sample AFTER RESTART. Each cell contains data for the Bundesliga (grey) in first row and for Bundesliga 2 (light grey) in second row. Test statistics d and p refer to ΔMP. # indicates applicable MP differences between leagues in PRECORONA_Q4. * indicates significant changes of MP.
