Fig. 3.

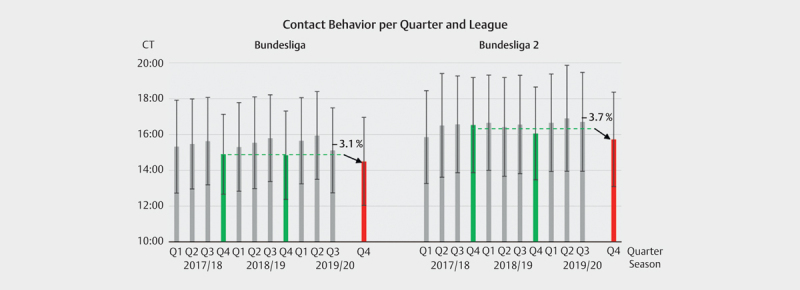
Player contacts in the Bundesliga and Bundesliga 2 grouped by quarters. Vertical bars show mean and standard deviation of Contact Time (CT) (min). Percentages indicate change of CT from PRECORONA Q4 to AFTER RESTART.

Player contacts in the Bundesliga and Bundesliga 2 grouped by quarters. Vertical bars show mean and standard deviation of Contact Time (CT) (min). Percentages indicate change of CT from PRECORONA Q4 to AFTER RESTART.