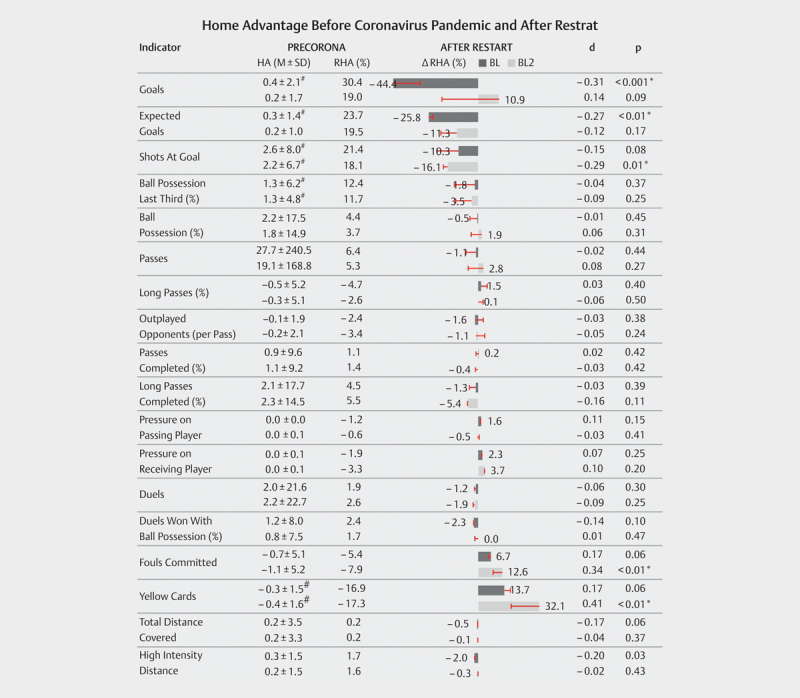
Fig. 6.

Analysis of home advantage according to performance indicators. Figure shows Home Advantage (HA) and Relative Home Advantage (RHA) (%) in sample PRECORONA, changes of Relative Home Advantage (ΔRHA) (%) in sample AFTER RESTART, effect size (d), and p value. Each cell contains data for the Bundesliga (grey) in first row and for Bundesliga 2 (light grey) in second row. Red lines inside bars indicate the change that would lead to home-away parity; # indicates applicable HA differences between home and away teams in PRECORONA; * indicates significant changes of RHA.
