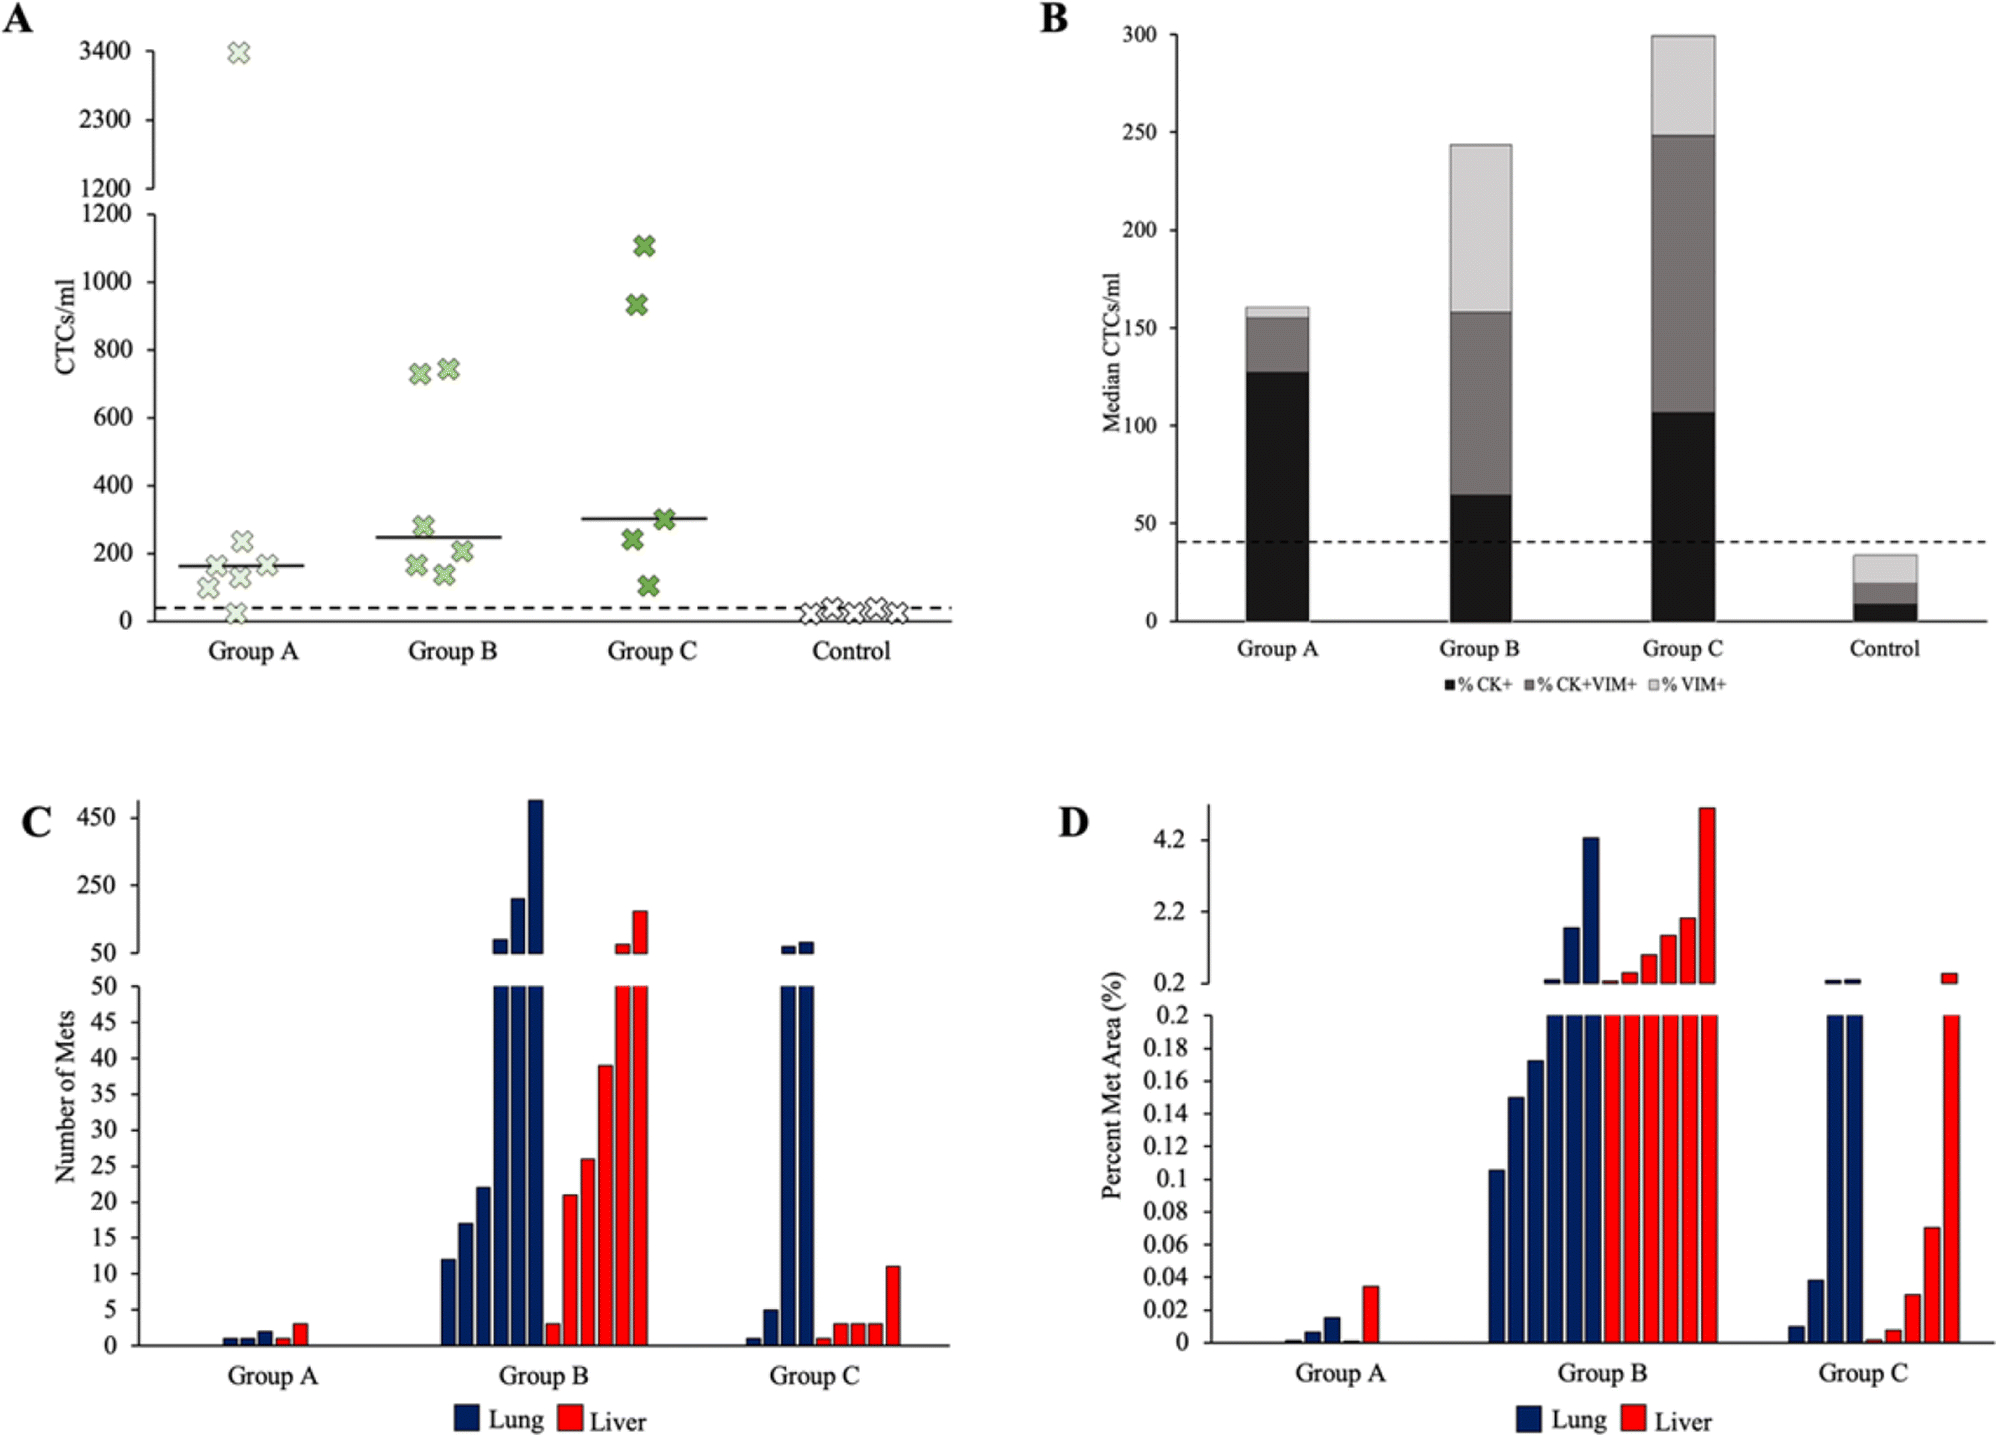
Figure 3.

CTC and metastasis data for PDOX models of TNBC. (A) The number of CTCs/ml for each mouse studied. The median for each group is represented by solid horizontal lines. The control threshold of 40 CTCs/ml is represented by a dashed horizontal line. (B) Percent of total CTCs/ml expressing different phenotypes in each group. Control mice had between 21 and 40 cells that stained similarly to CTCs, so a threshold of 40 CTCs/ml is set and represented by a dashed horizontal line. CK+ -cytokeratin positive, VIM+ -vimentin positive, CK+VIM+ -cytokeratin and vimentin positive. (C) The number of metastases found on the organ section with the largest metastatic burden for each mouse. Blue bars indicate lung data and red bars indicate liver data. (D) Percent area of metastases for each mouse studied. Areas were calculated as a percent of the organ tissue on the section with the largest metastatic burden.
