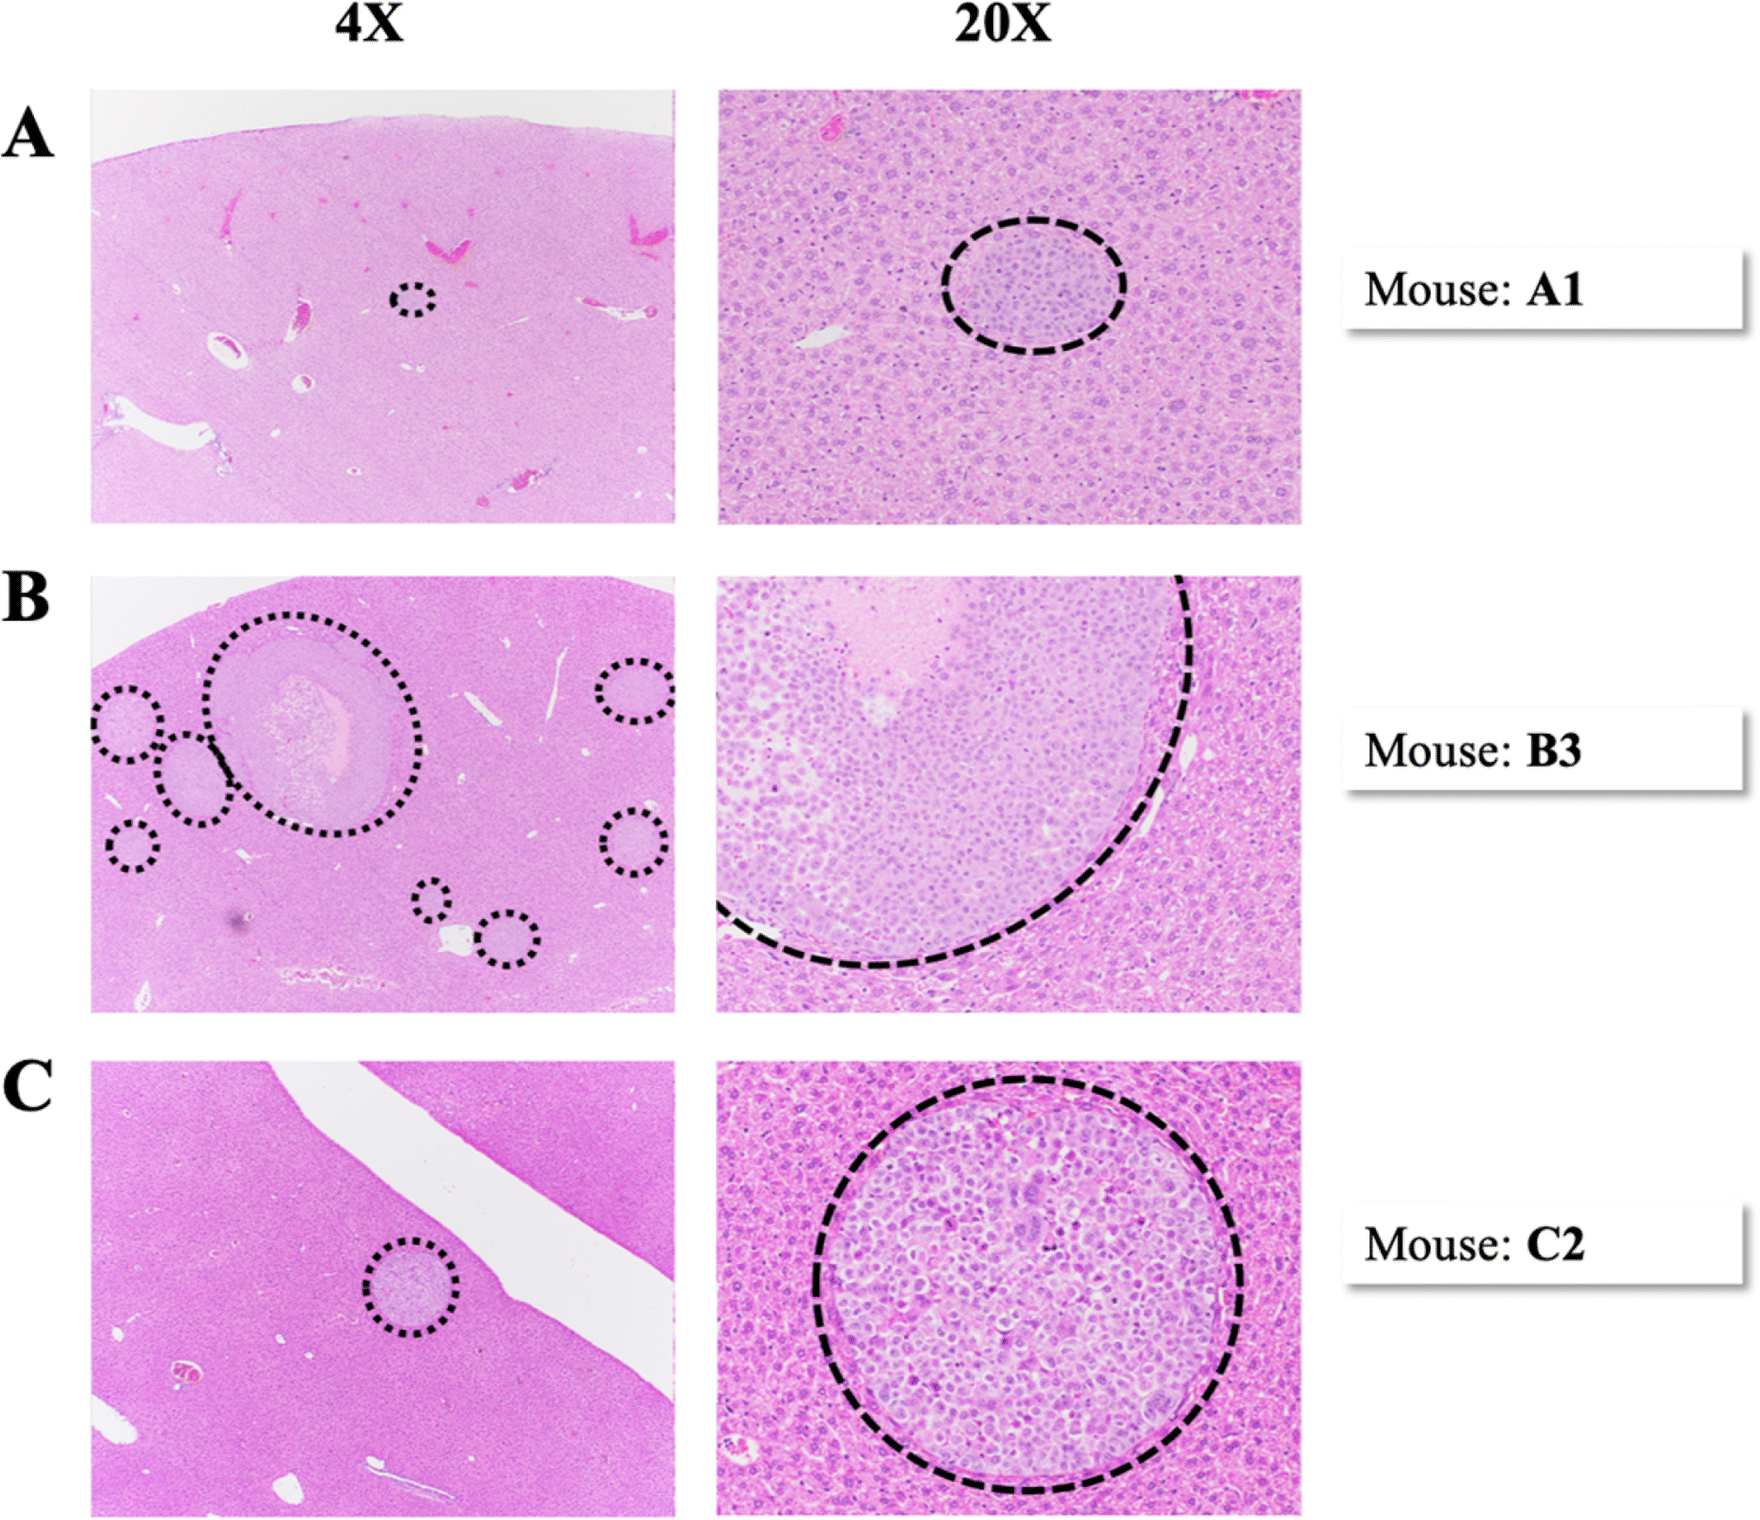
Figure 5.

Representative H&E images of metastases in the liver. Each row of images represents a separate mouse. Images in the left column were taken at 4x magnification and images in the right column were taken at 20x magnification. Dashed lines encircle metastases. (A) Mouse A1, Group A. (B) Mouse B3, Group B. (C) Mouse C2, Group C.
