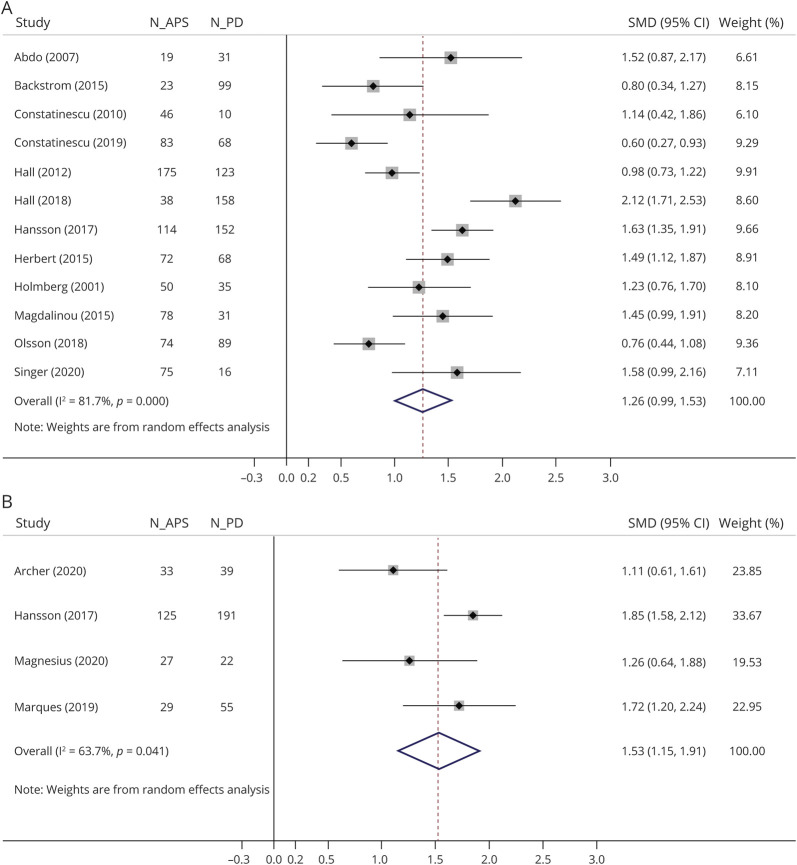
Figure 2. Forest Plots of the Meta-analyses of (A) CSF and (B) Circulating NfL Levels in Patients with APS vs PD.
SMDs of each study are depicted as data markers; shaded boxes around the data markers indicate the statistical weight of the respective study; 95% CIs are indicated by the error bars; pooled-effect estimates are reflected as a diamond. APS = atypical parkinsonian syndrome; CI = confidence interval; NfL = neurofilament light chain; PD = Parkinson disease; SMD = standardized mean difference.

