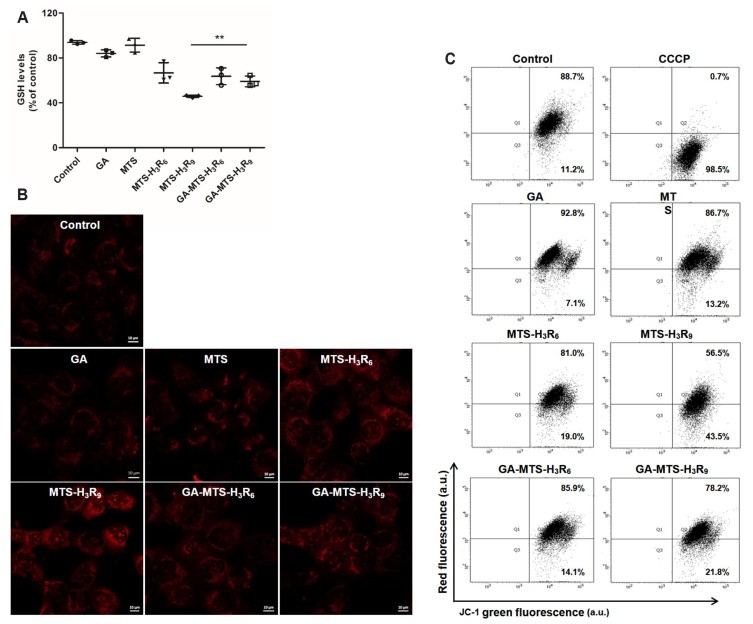
Fig. 7. ROS levels and mitochondrial membrane potential (MMP) with GA-MTS-H3R9.
(A) AC16 cells were exposed to 6.25 μM of GA, MTS, MTS-H3R6, MTS-H3R9, GA-MTS-H3R6, and GA-MTS-H3R9 for 16 h. Intracellular ROS levels were assessed by GSH assay. (B) AC16 cells were treated using the same conditions as those panel (A). The cells were treated with 20 μM MitoSox for 16 h. Cells were imaged by confocal microscopy. Scale bar is 10 µm. (C) AC16 cells were treated using the same conditions as those in panel (A). The cells were added to 2 μM JC-1 and then incubated for 20 min. MMP was determined by flow cytometry analysis. Data are indicted as the mean ± SD (n = 3). ROS, reactive oxygen species; GA, gallic acid; GSH, glutathione; MTS, mitochondria targeting sequence; CCCP, carbonyl cyanide 3-chlorophenylhydrazone. **p < 0.01.

