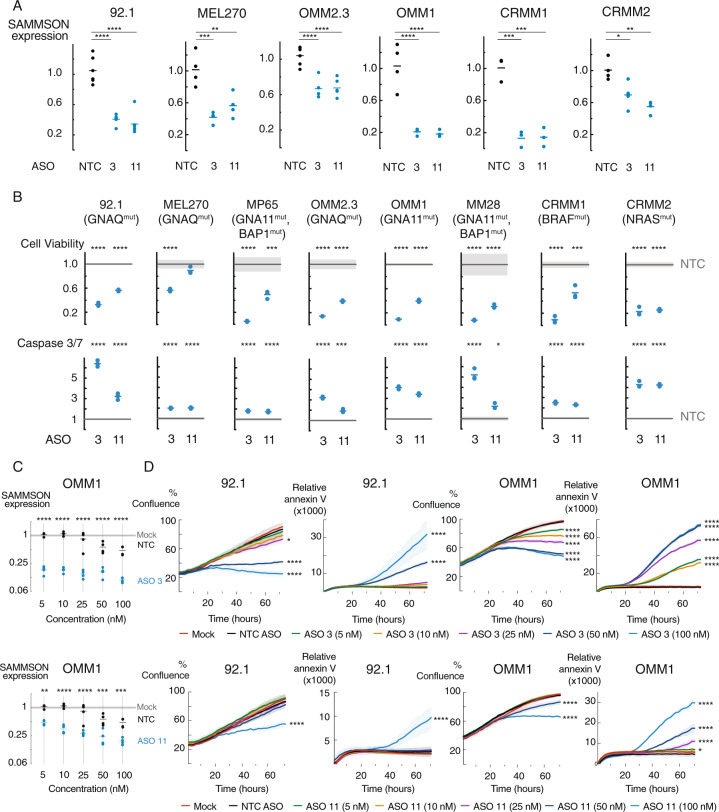
Fig. 2. SAMMSON knockdown reduces cell viability and confluence and induces apoptosis.
A Relative SAMMSON expression 48 h after transfection in four UM cell lines (92.1, MEL270, OMM2.3, OMM1) and two CM cell lines (CRMM1, CRMM2) transfected with 100 nM of a scrambled ASO (NTC), ASO 3 or ASO 11. The individual data points and mean are presented. B Cell viability (Cell Titer Glo) reduction and apoptosis (Caspase-Glo 3/7) induction in ASO 3 and ASO 11 treated UM and CM (CRMM1 and CRMM2) cells compared to NTC ASO treated cells (72 h post-transfection). The individual data points and mean of ASO 3 and ASO11 are presented. The NTC ASO treated data are presented as the mean of three replicates ± s.d. P values in (A) and (B) were calculated for each ASO 3/ASO 11 concentration and compared to NTC ASO using one-way ANOVA with Dunnett’s multiple testing correction. C Relative SAMMSON expression in UM cell line OMM1 48 h after transfection with 5, 10, 25, 50, or 100 nM of NTC ASO, ASO 3 or ASO 11 and scaled to untreated cells (Mock). The individual data points and mean of NTC ASO, ASO 3 and ASO11 are presented. The mock treated data are presented as the mean of four replicates ± s.d. P values were calculated for each ASO 3/ASO 11 concentration and compared to its corresponding NTC ASO concentration using one-way ANOVA with Dunnett’s multiple testing correction. D Reduction of proliferation (% confluence) and induction of apoptosis (annexin V) in 92.1 and OMM1 upon transfection with 5, 10, 25, 50, or 100 nM ASO 3 or ASO 11 compared to NTC ASO treatment or untreated cells (mock) measured by time-lapse microscopy (every 2–3 h) using the IncuCyte device. Data represents mean ± s.d. of three replicates. NTC ASO data represents the mean ± s.d. of all NTC ASO concentrations (5, 10, 25, 50, and 100 nM). P values were calculated at the 72 h time point compared to NTC ASO using one-way ANOVA with Dunnett’s multiple testing correction. *p ≤ 0.05, **p ≤ 0.01, ***p ≤ 0.001, ****p ≤ 0.0001.

