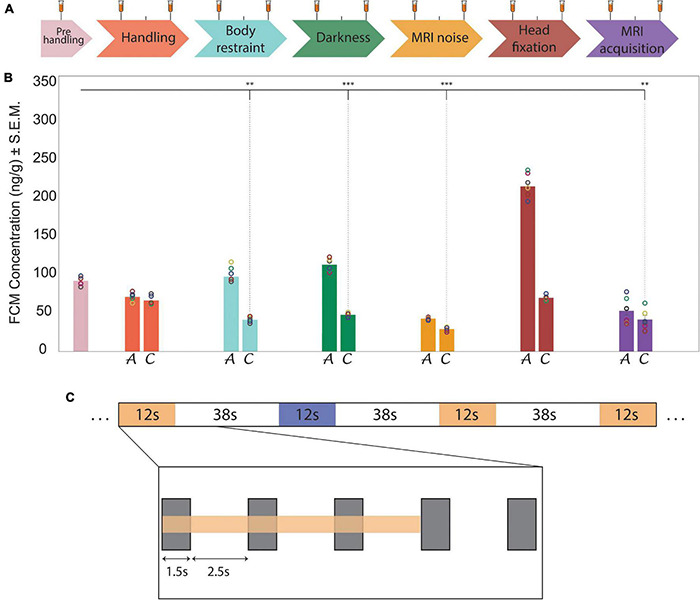
FIGURE 1.

Habituation protocol, stress level indicators of fecal corticosterone metabolites and experimental design of the auditory fMRI task.(A) Timeline representation of the habituation protocol that was designed to enable stable recordings during awake fMRI. (tick, 24 h; white space, 48 h break; long tick with test tube, stress sample collection, short tick, habituation without stress sample collection). (B) Bar charts show results from fecal corticosterone metabolite (FCM) assessments (n = 6). Circles indicate the single values obtained in the animals for each evaluation step. The bar chart colors correspond to the habituation and recording steps shown in the timeline in part (A). In each step, bar chart A reports the acute FCM levels and bar chart C reports the chronic FCM levels. FCM concentration is expressed as ng of FCM per g of fecal matter. Significance (One Way ANOVA) vs. pre-handling levels: **p ≤ 0.01, ***p ≤ 0.001. During the last phase of the habituation protocol FCM levels are significantly lower than pre-handling levels (t(5) ≥ 5.25, p < 0.03, n = 6). (C) Schematic representation of the auditory task. The two acoustic stimulation patterns (signified in yellow and blue) were randomly distributed during the sequence acquisition. A closer look at one sound stimulation (inlay) shows the duration of the scanner noise (gray rectangles) - relative to the slice acquisition period (TA = 1.5 s). This occurred at the beginning of each TR and was followed by a quiet period (no slice acquisition noise) of 2.5 s.
