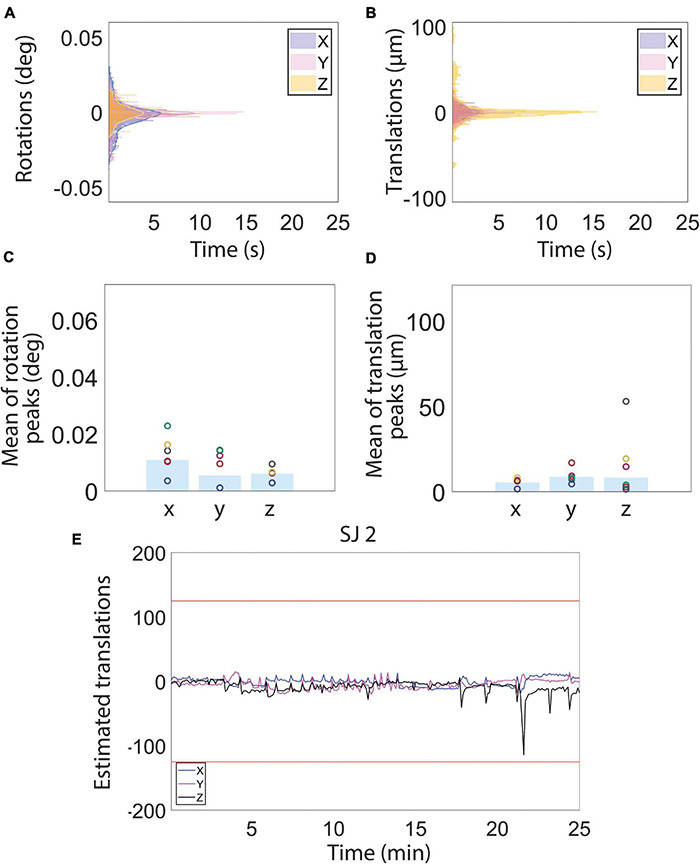
FIGURE 3.

Motion estimation derived from magnetic resonance images during resting state functional magnetic resonance imaging (fMRI) acquisition. (A–D) Histograms (A,B) and bar charts showing the peak mean of the estimated rotation (C) and translation (D) motion parameters. (E) Examples of estimated translation levels for a single subject (SJ 2). The red lines represent 1/4 of the voxel size. (See Figure 4 for motion traces of all other subjects). Low estimated translation values (smaller than 1/4 of voxel size) during the whole fMRI acquisition reflect a normal physiological state of the subjects, indicative, in turn, of low stress levels.
