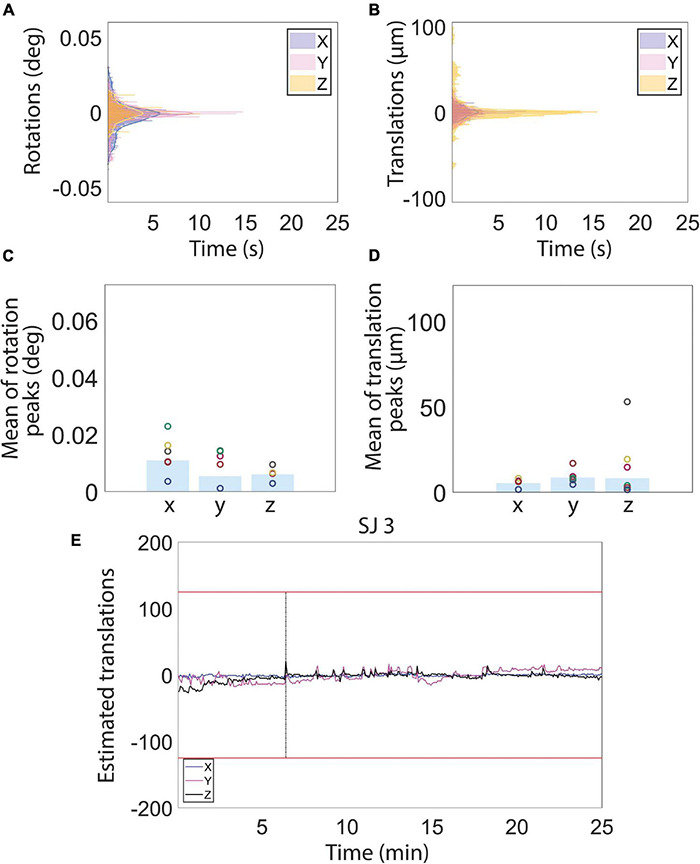
FIGURE 5.

Motion estimations derived from MR images during the auditory functional magnetic resonance imaging (fMRI) acquisition. (A–D) Histograms (A,B) and peak mean of the estimated rotation (C) and translation (D) motion parameters. (E) Representative example of estimated translation levels for a single subject (SJ 3). (See Figure 6 for motion traces of all other subjects). The red lines represent 1/4 of the voxel size. The vertical black line indicates the location of a spike in the time course that was removed using the Matlab toolbox, ArtRepair. Low estimated motion parameter values recorded during the whole fMRI acquisition reflect a physiological and calm state of the animals.
