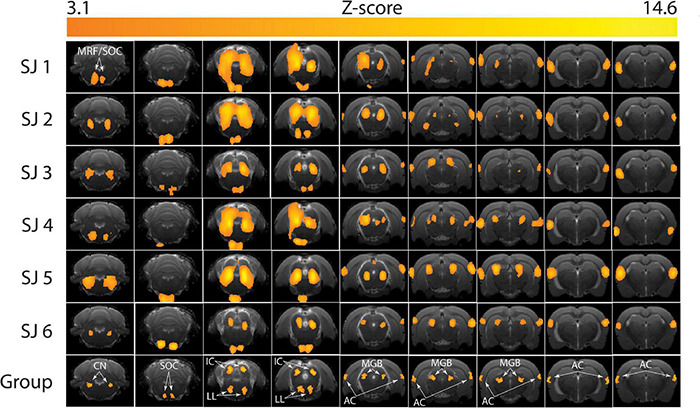
FIGURE 7.

Brain activation patterns during the functional magnetic resonance imaging (fMRI) auditory task. The Z-score maps are reported for each subject (SJ 1-6) at the end of the first-level analysis, and for the whole group after the higher-level analysis (bottom row). MRF, medullary reticular formation; CN, cochlear nucleus; SOC, superior olivary complex; IC, inferior colliculus; LL, lateral lemniscus; MGB, medial geniculate body; AC, auditory cortex. Higher single-subject-consistency is present in the IC, LL, MGB, and AC and lower single-subject-consistency in the CN and SOC.
