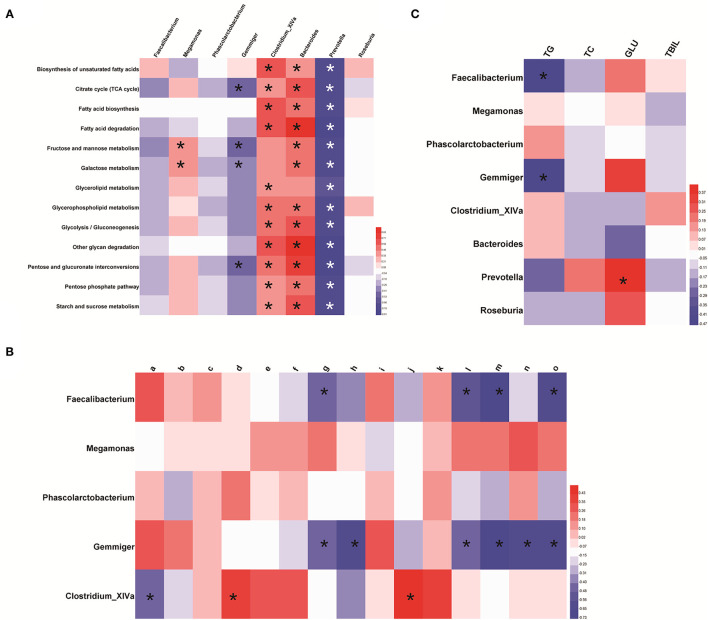
Figure 6.
Association between the distinct gut-microbiome profile and metabolism. (A) Featured bacterial genera and pathways related to glucose metabolism and lipid metabolism. The predicted pathway was screened based on the Wilcoxon test (p < 0.05 and |log2 FC| >1). (B) Association between the distinct gut-microbiome profile and differential metabolites related to glucose metabolism and lipid metabolism. Here, a represents N-acetylmuramic acid; b represents 4-hydroxybenzaldehyde; c represents Cis, cis-muconic acid; d represents 15(s)-hpete; e represents 13(s)-hotre; f represents 13(s)-hpotre; g represents Sn-3-o-(geranylgeranyl)glycerol 1-phosphate; h represents (3α,7α,12α)-3,7,12,26-tetrahydroxycholestan-27-yl hydrogen sulfate; i represents paromomycin; j represents L-kynurenine; k represents 9-oxo-ode; l represents palmitoylcarnitine; m represents estrone; n represents desoxycortone; o represents cholate. (C) Featured bacterial genera and clinical manifestations related to glucose metabolism and lipid metabolism. *p < 0.05. Red represents a positive correlation and, the darker the color, the more significant is the correlation; blue represents a negative correlation and, the darker the color, the stronger is the correlation.

