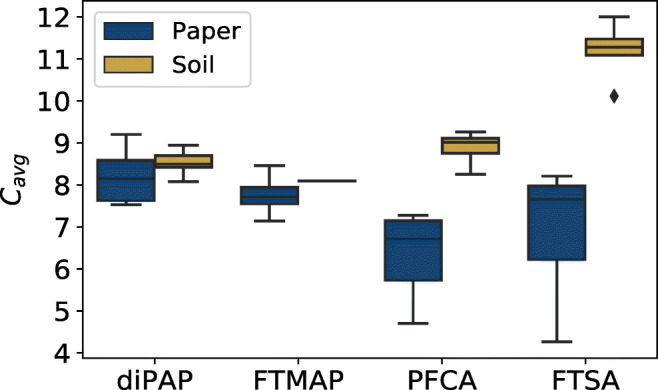
Fig. 4.

Box-whisker plot for the weighted average lengths of the perfluorinated carbon chain Cavg of diPAPs, FTMAPs, PFCAs, and FTSAs in 14 soil and 14 paper samples. For diPAPs and FTMAPs which bear two fluorotelomer carbon chains, only the average carbon length of one side chain was considered. The box represents 25 and 75 percentiles and the median, whiskers show the minimum and maximum values, and the diamond indicates an outlier
