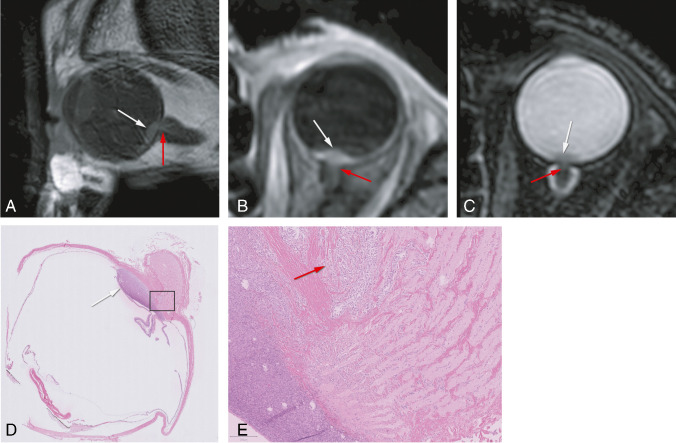
Fig. 8.
MR and histopathological images of a uveal melanoma with optic nerve invasion. A–C MRI with sagittal MS TSE T1-WI (A) and axials 3D TSE contrast-enhanced T1-WI with fat signal suppression (B) and T2-WI with fat signal suppression (C) showing a small lentiform shape UM of the left eye (white arrow) with minimal invasion of the optic nerve (red arrow). D–E Histopathologic examination H&E showing the UM (white arrow) with minimal invasion of the optic nerve (red arrow)

