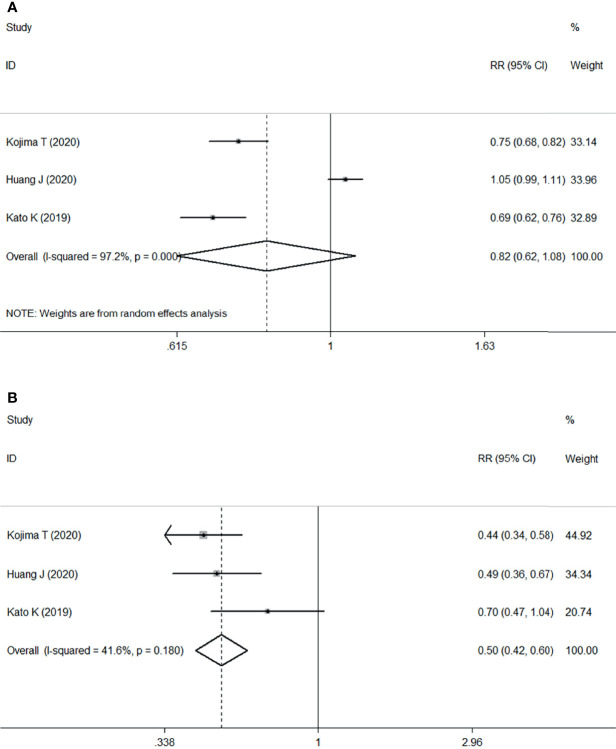
Figure 5.
Forest plots. (A) Forest plots of RR comparing TRAEs between patients treated with ICI and chemotherapy; (B) Forest plots of RR comparing grade ≥3 TRAEs between patients treated with ICI and chemotherapy. RR, relative risk; CI, confidence interval; ICI, immune checkpoint inhibitor; TRAEs, treatment-related adverse events.

