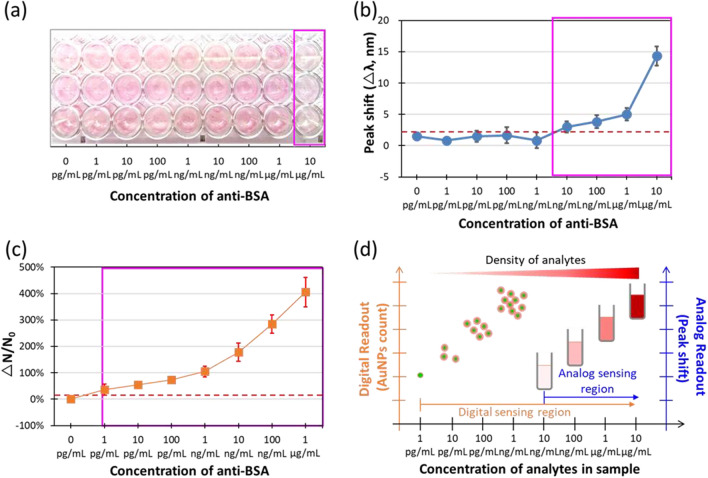
Fig. 5.
Readout signals of a naked-eye, b UV–Vis absorption spectra, and c Flow DiNM in response to various concentrations of anti-BSA conjugated to BSA20%@AuNPs. The red lines indicate the readout signal of LOD, and the magenta rectangles indicate the detecting dynamic range in this pilot experiment. The sample number of each method was six, and ± SD represents the error bar. d The schematic plot summarizes the LOD and dynamic range that the analog (UV–Vis absorption) and digital (Flow DiNM)-based LSPR immunoassay can achieve in this work. The format of this schematic plot was based on reference [20]

