Fig. 6.
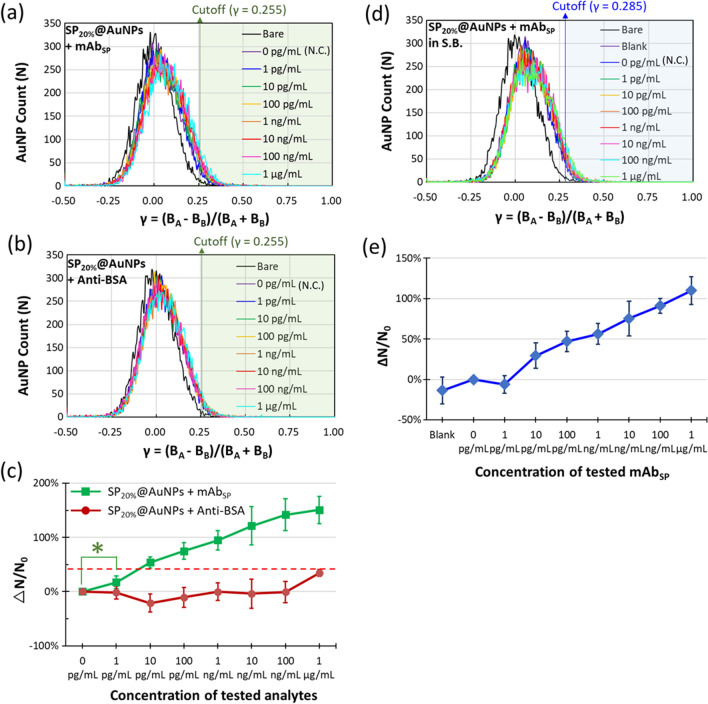
AuNP counts versus spectral contrast γ distributions of SP20%@AuNPs conjugated with different concentrations of a mAbSP and b anti-BSA in TE buffer. c Digital readout signals ΔN/N0 in response to mAbSP and anti-BSA. The red lines indicate the readout signal of LOD. d AuNP counts versus spectral contrast γ distributions of SP20%@AuNPs conjugated with different concentrations of mAbSP in artificial saliva (without any additive proteins, blank) and saliva buffer (S.B.) that contains HSA, IgA, IgG, and IgM. e The statistic ΔN/N0 in response to the mAbSP. The sample of each condition was six, and the error bar is represented by ± SD. *p = 0.015< 0.05

