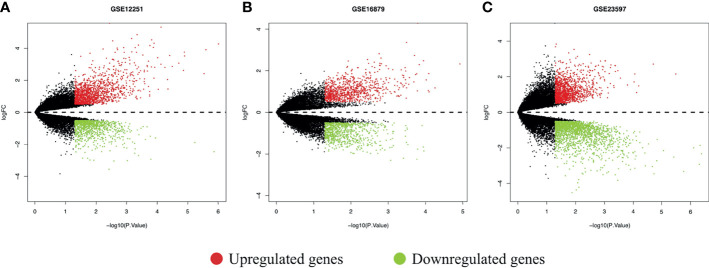
Figure 2.
DEGs between responders and non-responders in each dataset shown in volcano plots. (A) Volcano plot of the GSE12251 dataset; (B) volcano plot of the GSE16879 dataset; and (C) volcano plot of the GSE23597 dataset. The red dots represented upregulated genes based on a p-value < 0.05 and logFC > 0.5; the green dots represented downregulated genes based on a p-value < 0.05 and logFC<-0.5; the black spots represented genes with no significant difference in expression. DEGs, differentially expressed genes; logFC, log-fold change.

