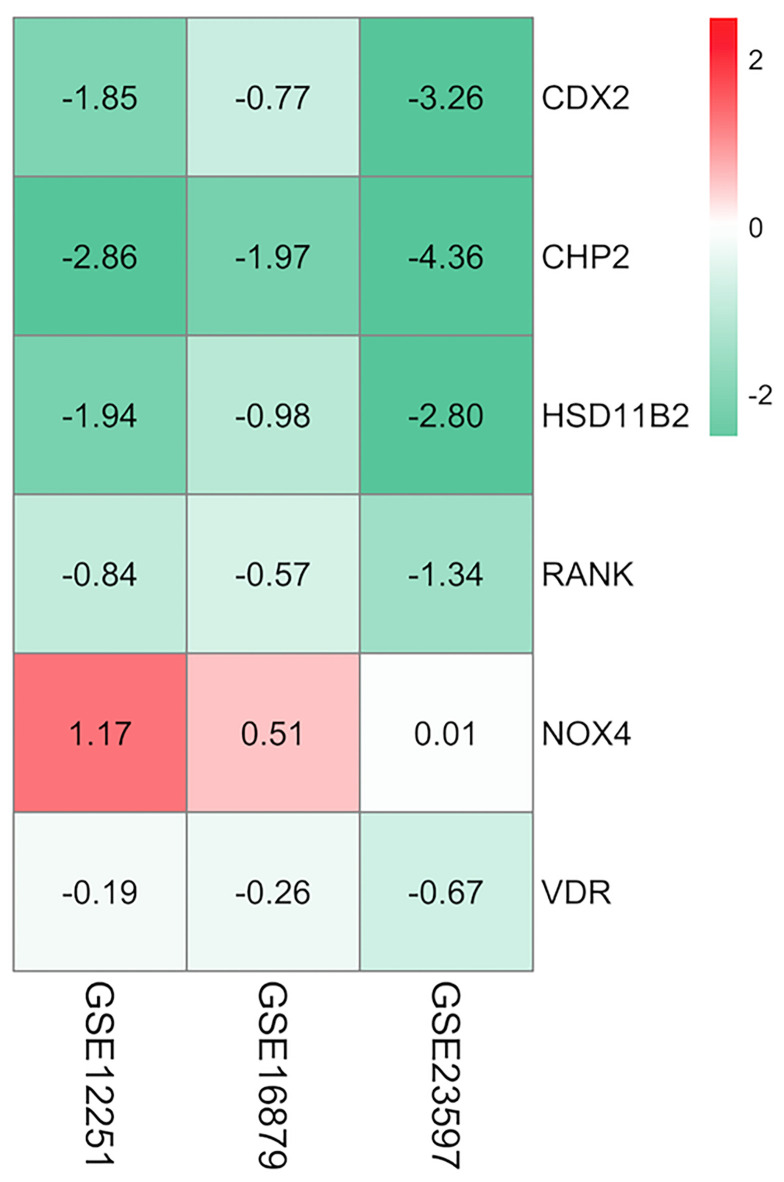
Figure 4.
Heatmap of the selected proteins. CDX2, CHP2, HSD11B2, RANK, and VDR displayed decreased expression, while NOX4 displayed increased expression; the red color represented logFC > 0, the green color represented logFC < 0 and the value in the box represented the logFC value. logFC, log fold change.

