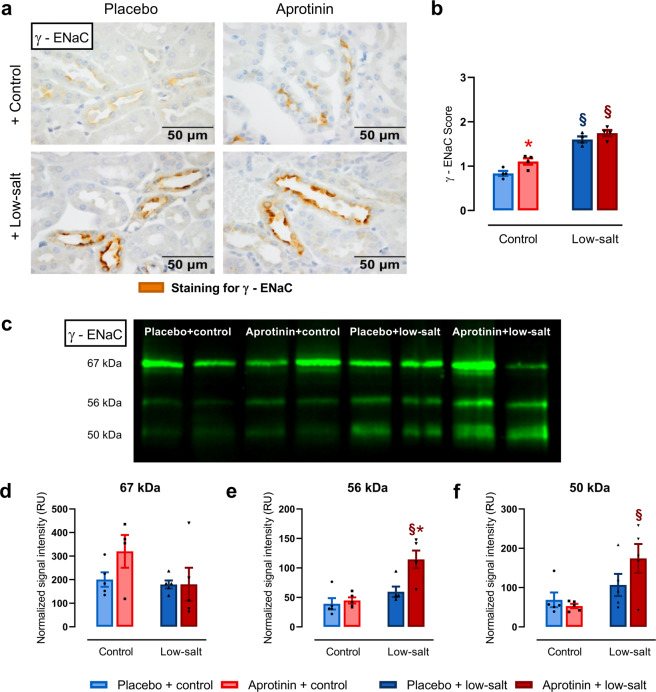
Fig. 3. Effect of aprotinin on expression of γ-ENaC in kidneys from healthy mice.
a Staining for γ-ENaC using immunohistochemistry in kidneys of mice treated with placebo and aprotinin under control and low-salt diet. Kidneys were harvested at day 9 (each n = 4). b Semiquantitative analysis of the obtained staining result (scale: no staining (0)–weak staining (1)–moderate staining (2)–strong staining (3); each n = 4). c Representative Western blot of lysates from kidneys of mice treated with placebo and aprotinin under control and low-salt diet. Kidneys were harvested at day 2. γ-ENaC was detected at 67, 56, and 50 kDa corresponding to full-length, furin-cleaved, and fully cleaved forms, respectively. d–f Densitometric analysis of the expression of the obtained bands (each n = 5). Signal intensity of the bands shown as relative units (RU) was normalized for total protein expression of the respective lane. Data and statistical analysis: arithmetic means ± SEM. b One-way ANOVA followed by the Dunnett’s test. d–f Unpaired t-test/Mann–Whitney test or One-way ANOVA/Kruskal–Wallis test followed by Dunnett’s/Dunn’s test. *P < 0.05, aprotinin vs. placebo treatment, §P < 0.05, low-salt vs. control diet.

