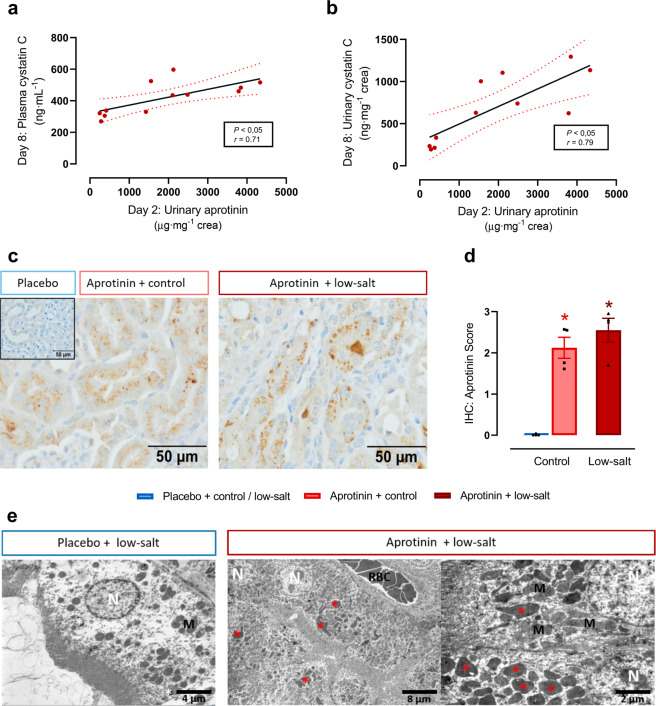
Fig. 6. Accumulation of aprotinin in renal tissue.
Correlation of urinary aprotinin concentration with plasma (a) and urinary cystatin C (b) concentration (each n = 11–12). c Immunohistochemical analysis of the tubular deposition and accumulation of aprotinin (each n = 4). d Semiquantitative analysis of aprotinin deposition (each n = 4). e Electron microscopy in different magnifications of proximal tubular cells from mice treated with placebo or aprotinin under a low-salt diet. In mice treated with placebo lysosomes in renal tubular cells appear normal in size and number (white asterisks). Whereas in mice treated with low-salt and aprotinin lysosomes were markedly increased in size and filled with electron-dense material (red asterisks). N nucleus, M mitochondria, RBC red blood cells (each n = 4). Data and statistical analysis: arithmetic means ± SEM. a, b Calculation of Pearson’s correlation coefficient r, P < 0.05; b one outlier removed (Grubb’s test–α = 0.01%). d Kruskal–Wallis test followed by the Dunn’s test. *P < 0.05, aprotinin vs. placebo treatment.

