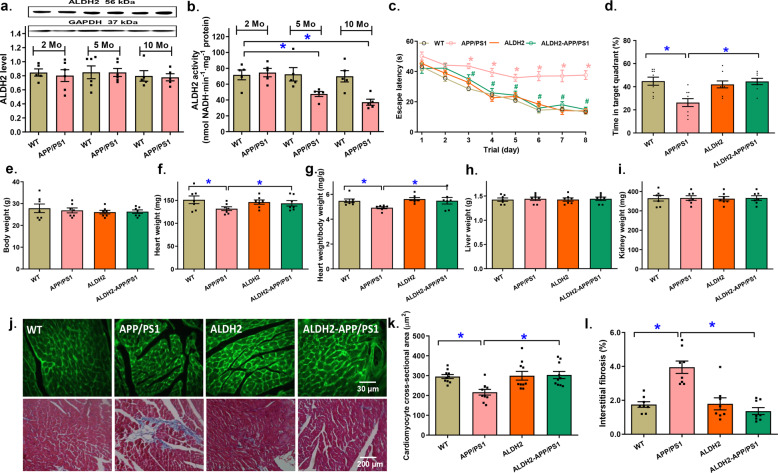
Fig. 1. The effect of age on myocardial ALDH2 expression and activity and the effect of ALDH2 overexpression on cognitive function, body and organ weight, and cardiac morphology in the APP/PS1 mouse model of Alzheimer’s disease.
a Myocardial ALDH2 levels at 2, 5, and 10 months of age; inset: representative gel bands depicting ALDH2 and GAPDH (loading control). b Myocardial ALDH2 activity at 2, 5, and 10 months of age; (c) Escape latency; (d) Time in target quadrant (%); (e) Body weight; (f) Heart weight; (g) Heart-to-body weight ratio; (h) Liver weight; (i) Kidney weight. j Representative images of FITC-lectin (×200) and Masson’s trichrome staining (×100) showing myocardial morphology. k Quantitative analysis of FITC-lectin cardiomyocyte cross-sectional area. l Quantitative analysis of fibrotic area (Masson’s trichrome-stained area in light blue color normalized to total cardiac area). Mean ± SEM, n = 7–8 mice per group, *P < 0.05 between the indicated groups.

